Download
1 / 36
360 likes | 590 Views
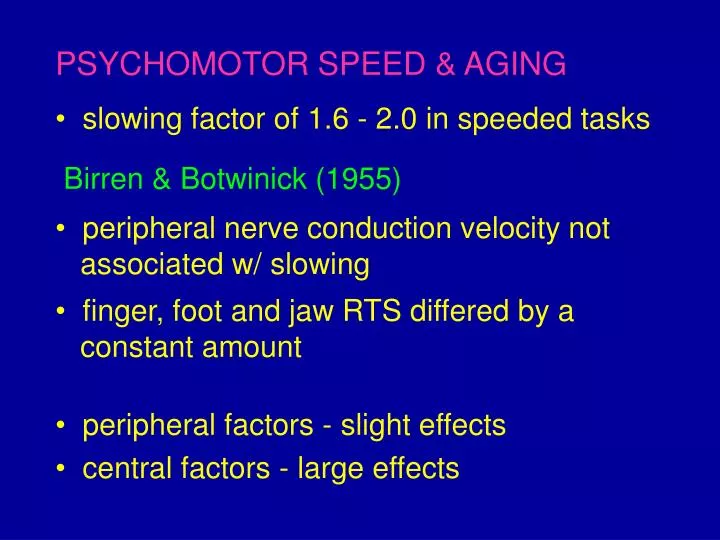
PSYCHOMOTOR SPEED & AGING. slowing factor of 1.6 - 2.0 in speeded tasks. Birren & Botwinick (1955). peripheral nerve conduction velocity not associated w/ slowing. finger, foot and jaw RTS differed by a constant amount. peripheral factors - slight effects.

E N D
PSYCHOMOTOR SPEED & AGING • slowing factor of 1.6 - 2.0 in speeded tasks Birren & Botwinick (1955) • peripheral nerve conduction velocity not • associated w/ slowing • finger, foot and jaw RTS differed by a • constant amount • peripheral factors - slight effects • central factors - large effects
Theories of Central Slowing A. Generalized Slowing Hypothesis • ‘electrical burnout’ • same cognitive operations, but slower rate • Strong Version: slowing same for all cognitive • functions BUT age differences across tasks depending on type of processing • Weak Version: some slowing evident in all • mental operations BUT vague, difficult to validate
B. Resource Reduction Hypothesis • decrease in quantity of some processing • resource(s) • common attributions: • attentional capacity, processing rate, WM • difficult to access b/c no specific resources • identified or measured • circular reasoning: age differences in • performance attributed to reduction in • putative resources; reductions in resource • capacity inferred from performance
C. Disconnection / Neural Network Hypothesis • processing in neural network w/ links, nodes • cognitive process = propagation of signal • Input Output • RT = time for signal to reach output node = (# links) x (time/link) • efficiency fewest links btwn input & output • aging destroys links, must detour increases number of links
Schematic Neural Network Network transmits signal left to right. One link in the original, intact route is broken, forcing the signal to detour and adding one more link to the path for a total of nine. From Cerella (1990)
D. Information-Loss Model • not breaks at links, per se, but what happens • during processing at each link 4 assumptions: (1) discrete steps, RT=total time for steps (2) time/step depends on amount of information available (3) information is lost during processing (4) age-related loss in rate of information loss
E. Increased Cautiousness • old - decreased tolerance of errors • difference in speed-accuracy set-point F. Decreased Use • lack of exercise of mental functions • with practice, reduce or eliminate deficits • to some extent, but biological limit
How can we slow down the slowing? Practice • considerable slowing but old seldom as fast • as young Exercise • physically active older adults faster Experience (Salthouse,1984) • 19-72 yr. olds, typing speed, Choice RT, • tapping, digit-letter substitution • age-related slowing on CRT but not for typing • older typists ‘look ahead’, anticipate
ATTENTION & AGING What is attention? “Everyone knows what attention is. It is the taking possession by the mind, in clear and vivid form, of one out of what seem several simultaneously possible objects or trains of thought.” -James, 1890 …but it’s more than simply selecting
A redefinition ... • Focussing on the screen • Dividing attention between several numbers • at once • Inhibiting or Filteringirrelevant information • (e.g., blue Es) • Shifting from one number to another • Maintenance of an overall state of Vigilance • and motivation
SELECTIVE ATTENTION • choosing what information will be processed • a lot of information coming in through our • senses, but only limited amount can be • processed further need to select which information to process Visual Search Tasks • find target stimulus among distractors • as # distractors es, target detection RT es • older adults - greater RT es
slope = 0 perfect selectivity • slope > 0 interference • slopes for older adults > young adults
Feature Integration Theory (FI; Treisman & Gelade) Visual processing consists of 2 main steps: (1) Feature Extraction • representing dimensions (2) Feature Integration • putting dimensions together operate serially Plude & Doussard-Roosevelt (1989) • acc: FIT, where in sequence of visual info • processing is age-related interference?
Plude & Doussard-Roosevelt cont’d ... Feature Conjunction • feature search: old and young slope = 0 • conjuction search: ed slope for older adults Only feature integration affected by age
Plude & Hoyer (1986) Is age-related increased interference just due to age-related reduction in parafoveal acuity? Search M Q W V Q Non-search V Q M W Q
Plude & Hoyer cont’d ... • interference greater for old in search condition Nonsearch Search (center) When target acuity equated, nontarget interference in visual search with old Confirms age-related selective attention deficit
Spatial Cueing Tasks • advance info re: subsequent target location • when cue location = target location • RTs and age differences disappear Madden (1990) Noise-Absent: + X Noise-Present: + RRRRRXRRRRRRRRRRRRR
Madden cont’d ... Noise-absent Noise-present • eccentricity effect was greater for noise- • present displays, more pronounced in old
Some conclusions ... • age-related differences in feature integration • are due in turn to age-related decrements • in spatial localization • however, these differences disappear when • information is provided re: location (cueing) • but, this benefit is reduced for older adults, • especially when there is distraction and as • the target stimulus moves extrafoveally • practice and experience may help alleviate • decrements
Why do older adults sometimes show poor selective attention? • selective attention = excitation + inhibition • old have difficulty inhibiting the processing of • irrelevant information (Hasher & Zacks, 1988) • measures of brain activity suggest reduced • attention-related activity in frontal regions in • older adults • plus, increased brain responses to irrelevant/ • distracting information in modality-specific • brain regions in older adults
May & Hasher (1998) • ability to inhibit may be modulated by time of • day in older adults • old - morning-type • young - evening/neutral-type • Stroop Task green yellow red green yellow • ‘synchrony effect’ - older better in the morning • Frontal lobe activity changes with time of day?
CAPACITY • how much information can be processed • automatic minimal demands on attention • unaware • controlled demands some/all attention • requires awareness Divided Attention (DA) Tasks • simultaneous processing of multiple sources • of information, i.e, dual-tasks • success depends on attentional capacity • older adults report difficulties w/ dual-tasks
Craik (1977) - age-related decrements in DA • are inevitable BUT • age-related differences on single-task • performance were not considered • Somberg & Salthouse (1982) • considered each task alone • equated performance on 2 tasks alone • age-related DA effect eliminated • some DA tasks affected by age, some not ...
McDowd & Craik (1988) • Salthouse & Somberg’s tasks automatic • processing require minimal attnal capacity? • manipulated difficulty of tasks • auditory: listen to list of spoken words • easy female difficult living things • visual: alphanumeric character on 4-sq. grid • easy position difficult cons/vowel/ • even#/odd# • perform each task alone • all combinations of auditory and visual tasks
McDowd & Craik (1988) voice voice category category position character position character task complexity, not DA per se, that accounts for age-related deficits
SUSTAINED ATTENTION (SA) • how well one is able to maintain attention • in order to perform a task for a long time • 2 main measures of SA: (1) vigilance performance (2) vigilance decrement • processes involved in vigilance tasks • alertness • adaptation & expectancy • sustained allocation of attentional capacity • development of automaticity
Alertness • related to vigilance performance • old poorer, related to physiological arousal Expectancy • target 10%, informed pr.=10% or pr.=50% • told incorrect prob. info no age-effect • vary uncertainty of target location • no age-effects w/ low level of uncertainty • age-effect on vigilance performance w/ • increasing uncertainty
Automatic vs Controlled Processes Automatic = fast, reliable, demand little attention, insensitive to cognitive demands Controlled = slow, variable, demand attention insensitive to cognitive demands Sustaining controlled attentional processing may be more difficult for older adults • old more susceptible to lapses on Stroop task • old show more intrusion errors • longer lapses in old • greater fluctuation of attention in old
Can old ‘automatize’ controlled processes? Rogers et al. (1994) • train/practice on 1 of 2 visual search tasks (a) consistent mapping (CM) nonoverlapping target & distractor, same target e.g., N (target) B D F N T (search) N (target) G N O M Q (search) (b) varied mapping (VM) target differs on each trial, items server inter- changeably as targets and distractors e.g., N (target) B D F N T (search) F (target) G N O F Q (search)
Rogers et al. cont’d ... • Results: VM task w/ Memory Search - both young and old show DA decrements CM task w/ Memory Search - only old still show DA decrements • Conclusions: old unable to automatize CM task well-trained target in CM automatically captured attention for young, but not old
DRIVING & AGING • drivers 75yrs+ have crash rates of 16-24 yr olds • age alone is not the issue, avoid stereotypes • driving = independence • self-restriction is obviously not enough • Ontario physicians must report unsafe drivers How do we determine when driving is safe? • compendium of illnesses, drugs that make • older drivers unsafe • tests of mental competence • evaluate actual driving performance
Owsley et al. (1998) • visual acuity weakly associated w/ crash risk • what about visual attention and processing? • Useful Field of View Test: • area over which visual info processed rapidly • rapid localization in periphery simultaneous • w/ target discrimination centrally • vary eccentricity and duration • score = % reduction in UFOV (0-90%) • older drivers w/ 40%+ reduction 2.2x more • likely to incur crash in 3yr. follow-up
DriveABLE • develop road test that identifies older drivers • who are not competent • observed healthy young and old drivers, as • well drivers 65ys+ w/ cognitive impairment • came up w/ 3 classes of driver error • Errors That Do Not Count • Discriminating Errors • Criterion Errors • many drivers too unsafe, even for road test
DriveABLE Competence Screen • develop competency screen that accurately • predicts who is likely to fail/pass road test • computerized (touch screen),empirically-based (1) Motor Speed and Control (2) UFOV (3) Complex Judgement (4) Attention Switching (5) Executive Function (6) Component Driving Abilities • video clips from driver’s perspective, • choose best action to take
Lower Criterion Upper Criterion Intermediate DriveABLE Competence Screen, cont’d... • 2 criterion points set, high accuracy at endpoints High probability of failing road test FAIL Low probability of failing road test PASS No accurate prediction ROAD TEST NEEDED