Download
1 / 32
320 likes | 506 Views
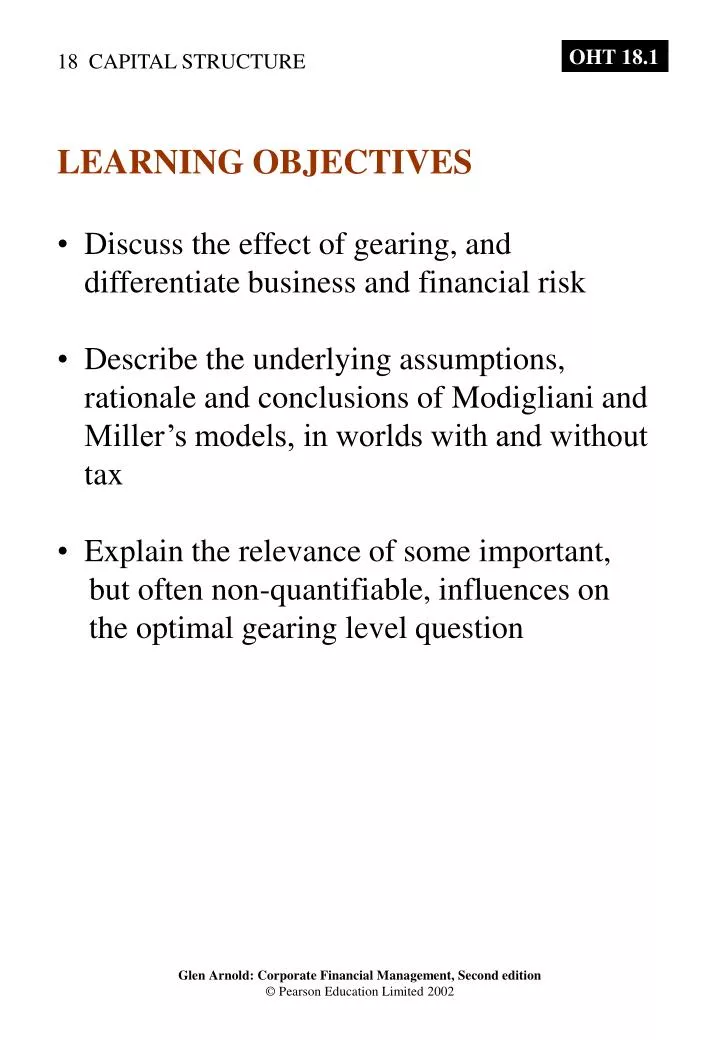
LEARNING OBJECTIVES Discuss the effect of gearing, and differentiate business and financial risk Describe the underlying assumptions, rationale and conclusions of Modigliani and Miller’s models, in worlds with and without tax Explain the relevance of some important,

E N D
LEARNING OBJECTIVES • Discuss the effect of gearing, and • differentiate business and financial risk • Describe the underlying assumptions, • rationale and conclusions of Modigliani and • Miller’s models, in worlds with and without • tax • Explain the relevance of some important, • but often non-quantifiable, influences on • the optimal gearing level question
DEBT FINANCE IS CHEAPER AND RISKIER (FOR THE COMPANY) • Lenders require a lower rate of return than ordinary shareholders • Debt interest can be offset against pre-tax profits before the • calculation of the corporation tax bill, thus reducing the tax paid • Issuing and transaction costs associated with raising and servicing debt are generally less than for ordinary shares Gearing level Low High Overall cost of finance (if the returns to equity High Low are constant or do not rise much with gearing*) Risk of the company becoming financially Low High distressed Note: This assumption is considered in the text. Exhibit 18.1 At low gearing levels the risk of financial distress is low, but the cost of capital is high; this reverses at high gearing levels
WHAT DO WE MEAN BY ‘GEARING’? • Operating gearing • Financial gearing • Note: Gearing and leverage are used interchangeably. Capital gearing Income gearing Overall perspective on debt levels Exhibit 18.2 A firm’s financial gearing can be measured in two ways
CAPITAL GEARING Capital gearing (1) = Long-term debt Shareholders’ funds Capital gearing (2) = Long-term debt Long-term debt + Shareholders’ funds Capital gearing (3) = All borrowing All borrowing + Shareholders’ funds Capital gearing (4) = Long-term debt Total market capitalisation
INCOME GEARING Interest cover = Profit before interest and tax Interest charges The inverse of interest cover is called income gearing.
THE EFFECT OF GEARING • The introduction of interest-bearing debt ‘gears up’ the returns to the shareholders. • Example: Harby plc • Three different capital structures • £10m of capital being raised • 1 All equity – 10 million shares sold at a • nominal value of £1 • 2 £3m debt (carrying 10 per cent interest) and • £7m equity • 3 £5m debt (carrying 10 per cent interest) and • £5m equity Customer response to firm’s products Income before interest* Probability (%) Modest success £0.5m 20 Good response £3.0m 60 Run-away success £4.0m 20 Exhibit 18.6 Probabilities of performance levels
Exhibit 18.7 The effect of gearing Customer r esponse Modest Good Run-away Ear nings befor e inter est £0.5m £3.0m £4.0m All-equity str uctur e Debt inter est at 10% 0.0 0.0 0.0 Ear nings available for shar eholders £0.5m £3.0m £4.0m Retur n on shar es £0.5m £3.0m £4.0m = 5% = 30% = 40% £10m £10m £10m 30% Gearing (£3m debt, £7m equity) Debt inter est at 10% £0.3m £0.3m £0.3m Ear nings available for shar eholders £0.2m £2.7m £3.7m Retur n on shar es £0.2m £2.7m £3.7m = 3% = 39% = 53% £7m £7m £7m 50% Gearing (£5m debt, £5m equity) Debt inter est at 10% £0.5m £0.5m £0.5m Ear nings available for shar eholders 0.0 £2.5m £3.5m Retur ns on shar es £0.0m £2.5m £3.5m = 0% = 50% = 70% £5m £5m £5m
Returns to shareholders (%) 50% debt, 50% equity structure 50 All-equity structure 30 Returns to shareholders (%) 10 0 0.5 1.0 2.0 3.0 Earnings before interest, £m Exhibit 18.8 Changes in shareholder returns for ungeared and geared capital structures
EXPECTED RETURNS AND STANDARD DEVIATIONS FOR HARBY PLC All equity Return, R (%) Probability, pi Return Probability 5 0.2 1 30 0.6 18 40 0.2 8 27 Expected return, R = 27% Return, R(%) Expected return, R Probability (R – R)2pi 5 27 0.2 96.8 30 27 0.6 5.4 40 27 0.2 33.8 Variance 2 = 136.0 30% Gearing Standard deviation = 11.7% Return, R(%) Probability, pi Return Probability 3 0.2 0.6 29 0.6 23.4 53 0.2 10.6 34.6 Expected return, R = 34.6% Return, R(%) Expected return, R Probability (R – R)2pi 3 34.6 0.2 199.71 39 34.6 0.6 11.62 53 34.6 0.2 67.71 Variance 2 = 279.04 Standard deviation = 16.7% Exhibit 18.9 Expected returns and standard deviations of return to shareholders in Harby plc
EXPECTED RETURNS AND STANDARD DEVIATIONS FOR HARBY PLC 50% Gearing Return, R (%) Probability, pi Return Probability 0 0.2 0 50 0.6 30 70 0.2 14 44 Expected return, R = 44% Return, R(%) Expected return, R Probability (R – R)2pi 0 44 0.2 387.2 50 44 0.6 21.6 70 44 0.2 135.2 Variance 2 = 544.0 Standard deviation = 23.3% Exhibit 18.9 Expected returns and standard deviations of return to shareholders in Harby Plc
BUSINESS RISK AND FINANCIALRISK • Business risk is the variability of the • firm’s operating income, that is, the • income before interest • Financial risk is the additional • variability in returns to shareholders that • arises because the financial structure • contains debt Gearing Expected return Standard deviation Business risk Remaining total (%) to shareholders (total risk) (%) risk due to (%) (%) financial risk* (%) 0 (all equity) 27 11.7 11.7 0 30 34.6 16.7 11.7 5 50 44 23.3 11.7 11.6 Exhibit 18.10 A company has responsibilities to a number of interested parties
THE VALUE OF THE FIRM AND THE COST OF CAPITAL C1 WACC where: V = value of the firm; C1 = cash flows to be received one year hence; WACC = the weighted average cost of capital. The value of the firm, V, is the combination of the market value of equity capital, VE (total capitalisation of ordinary shares), plus the market value of debt capital, VD. V = VE + VD V =
DOES THE COST OF CAPITAL (WACC) DECREASE WITH HIGHER DEBT LEVELS? • The firm’s cost of capital depends on both the return needed to satisfy the ordinary shareholders given their opportunity cost of capital kD and the return needed to satisfy lenders given their opportunity cost of capital kD. • WACC = kEWE1kDWD • where: WE = proportion of equity finance to total finance; • WD =proportion of debt finance to total finance. • Assume: • the cost of equity capital is 20 per cent • the cost of debt capital is 10 per cent • the equity and debt weights are both 50 per cent • the overall cost of capital is 15 per cent • WACC = 20% • The firm is expected to generate a perpetual annual cash flow of £1m. The total value of the firm is: • C1 £1m • WACC 0.15 V = = £6.667m =
DOES WACC DECREASE WITH HIGHER DEBT LEVELS? Scenario 1 The cost of equity capital remains at 20 per cent If shareholders remain content with a 20 per cent return, the WACC decreases: WACC = kEWE1 kDWD WACC = 20% 0.3 + 10% 0.7 = 13% The value of the firm increases: C1 £1m WACC 0.13 Scenario 2 The cost of equity capital rises due to the increased financial risk to exactly offset the effect of the lower cost of debt In this case the WACC and the firm’s value remain constant. WACC = kEWE + kDWD WACC = 26.67% 0.3 + 10% 0.7 = 15% V = = = £7.69m
DOES WACC DECREASE WITH HIGHER DEBT LEVELS? Scenario 3 The cost of equity capital rises, but this does not completely offset all the benefits of the lower cost of debt capital Assume that equity holders demand a 22 per cent return at a 70 per cent gearing level: WACC = kEWE + kDWD WACC = 22% 0.3 + 10% 0.7 = 13.6% C1 £1m WACC 0.136 Scenario 4 The cost of equity rises to more than offset the effect of the lower cost of debt Assume that a return of 40 per cent is required by shareholders: WACC = kEWE + kDWD WACC = 40% 0.3 + 10% 0.7 = 19% C1 £1m WACC 0.19 V = = = £7.35m V = = = £5.26m
MODIGLIANI AND MILLER’S • ARGUMENT IN A WORLD WITH • NO TAXES • Proposition 1 • The total market value of any company is • independent of its capital structure • The assumptions • There is no taxation. • 2 There are perfect capital markets, with perfect information available to all economic agents and no transaction costs. • 3 There are no costs of financial distress and liquidation (if a firm is liquidated, shareholders will receive the same as the market value of their share prior to liquidation). • Firms can be classified into distinct risk classes. • 5 Individuals can borrow as cheaply as corporations.
MODIGLIANI AND MILLER’S • NO-TAX CAPITAL STRUCTURE ARGUMENT • An example: Pivot plc • £1m capital needed to buy machines, plant • and buildings • The required return on that level of • systematic risk for an all-equity firm is 15 per • cent • The expected annual cash flow is a constant • £150,000 in perpetuity • This cash flow will be paid out each year to • the suppliers of capital • Consider three different finance structures: • Structure 1 All equity (1,000,000 shares selling at £1 each). • Structure 2 £500,000 of debt capital giving a return of 10 per cent per annum. Plus £500,000 of equity capital (500,000 shares at £1 each). • Structure 3 £700,000 of debt capital giving a return of 10 per cent per annum. Plus £300,000 of equity capital (300,000 shares at £1 each).
Exhibit 18.12 Pivot plc capital structure and returns to shareholders Str uctur e 1 Str uctur e 2 Str uctur e 3 £ £ £ Annual cash flows 150,000 150,000 150,000 less inter est payments 0 50,000 70,000 Dividend payments 150,000 100,000 80,000 Retur n on debt, kD 0 50,000/500,000 = 10% 70,000/700,000 = 10% Retur n on equity , kE 150,000/1m = 15% 100,000/500,000 = 20% 80,000/300,000 = 26.7% Price of each shar e, 15p 20p 26.7p = 100p = 100p = 100p d1 0.15 0.20 0.267 kE WACC 15 1.0 + 0 = 15% 20 0.5 + 10 0.5 = 15% 26.7 0.3 + 10 0.7 = 15% (kEWE + kDWD) T otal market value of debt, VD 0 500,000 700,000 T otal market value of equity , VE 150,000 100,000 80,000 = 1m = 0.5m = 0.3m 0.15 0.2 0.267 T otal value of the fir m, V = VD + VE £1,000,000 £1,000,000 £1,000,000
Returns to shareholders (%) Return % Exhibit 18.13 The cost of debt, equity and WACC under the MM no-tax model k E 15 W ACC Return % 10 k D Debt/Equity
Returns to shareholders (%) Return % V alue £m WACC If the WACC is constant and cash flows do not change, then the total value of the firm is constant: V = VE + VD = £1m C1 £150,00 WACC 0.15 = £1m V = = Exhibit 18.14 Value of the firm under the MM no-tax model V Value £m Debt/Equity
MODIGLIANI AND MILLER’S ARGUMENT IN A WORLD WITH NO TAXES Proposition 2 The expected rate of return on equity increases proportionately with the gearing ratio Proposition 3 The cut-off rate of return for new projects is equal to the weighted average cost of capital – which is constant regardless of gearing
Returns to shareholders (%) Return % V alue £m Return % Return % Returns to shareholders (%) alue Return % V V alue £m THE CAPITAL STRUCTURE DECISION IN A WORLD WITH TAX Exhibit 18.15 MM with tax k E Return % 15 W ACC k (1 – T ) 7 D Debt/Equity Exhibit 18.16 Value of the firm, MM with tax V Value Debt/Equity
Uncertainties in customers’ minds about dealing with this firm – lost sales, lost profits, lost goodwill. Uncertainties in suppliers’ minds about dealing with this firm – lost inputs, more expensive trading terms. If assets have to be sold quickly the price may be very low. Delays, legal impositions, and the tangles of financial reorganisation may place restrictions on management action, interfering with the efficient running of the business. Management may give excessive emphasis to short-term liquidity, e.g. cut R&D and training, reduce trade credit and stock levels. Temptation to sell healthy businesses as this will raise the most cash. Loss of staff morale, tendency to examine possible alternative employment. To conserve cash, lower credit terms are offered to customers, which impacts on the marketing effort. FINANCIAL DISTRESS Financial distress: where obligations to creditors are not met or are met with difficulty Direct examples Indirect examples Lawyers’ fees. Accountants’ fees. Court fees. Management time. Exhibit 18.18 Costs of financial distress
Exhibit 18.20 The cost of capital and the value of the firm with taxes and financial distress, as gearing increases k E W ACC Return % k D A T Debt/Equity V alue of geared firm with tax effect only considered Costs of financial distress Value V alue of firm with taxes and financial distress costs Optimal gearing level Debt/Equity
SOME FACTORS INFLUENCING THE RISK OF FINANCIAL DISTRESS COSTS 1 The sensitivity of the company’s revenues to the general level of economic activity 2 The proportion of fixed to variable costs 3 The liquidity and marketability of the firm’s assets 4 The cash-generative ability of the business
Exhibit 18.21 The characteristics of the underlying business influences the risk of liquidation/distress, and therefore WACC, and the optimal gearing level Characteristic Food r etailer Steel pr oducer Sensitivity to economic Relatively insensitive to Dependent on general activity economic fluctuations economic pr osperity Operational gearing Most costs ar e variable Most costs ar e fixed Asset liquidity Shops, stock, etc., easily sold Assets have few/no alternative uses. Thin secondhand market Cash-generative ability High or stable cash flow Ir r egular cash flow Likely acceptable HIGH LOW gearing ratio
OTHER FACTORS AFFECTING LEVELS OF DEBT (1) 1 Agency costs Agency costs are the direct and indirect costs of ensuring that agents act in the best interest of principals. 2 Borrowing capacity Lenders prefer secured lending, and this often sets an upper limit on gearing. 3 Managerial preferences Managers have a natural tendency to be cautious about borrowing.
OTHER FACTORS AFFECTING LEVELS OF DEBT (2) • 4 Pecking order for financing • Firms prefer to finance with internally-generated funds. • A firm first of all tries to finance investments by • using the store of previous years’ profits • If still more funds are needed, firms will go to the • capital markets • Debt market is called on first • Only as a last resort will companies resort to raising • equity finance. • Reasons: • 1 The stock markets perceive an equity issue as a sign • of problems • 2 Managers are following a line of least resistance • 3 Ordinary shares are more expensive to issue than • debt capital, which in turn is more expensive than • simply applying previously generated profit
OTHER FACTORS AFFECTING LEVELS OF DEBT (3) 5 Financial slack 6Signalling 7Control 8 Industry group gearing
IDEAS ON DEBT FINANCE • Motivation • Reinvestment risk • Operating and strategic efficiency
Exhibit 18.25 WACC is U-shaped and value can be altered by changing the gearing level W ACC Return % Major influences: Major influences: – lower cost of debt – financial distress/bankruptcy cost – tax relief on debt – agency costs Debt/Equity Other factors The debt-equity ratio can also be affected by other factors. In the list below , the direction of the effect is indicated by an arrow . 1 Borrowing capacity 2 Managerial preference 3 Pecking order tends to argue for 4 Financial slack lowering debt level 5 Signalling tends to argue for raising debt level 6 Control uncertain 7 Industry group gearing 8 Motivation 9 Reinvestment risk 10 Operating and strategic efficiency Firm’s value Debt/Equity