Download
1 / 27
280 likes | 370 Views
Global Precipitation Products for Data-Denied Regions. Stanley Q. Kidder Center for Geosciences/Atmospheric Research Colorado State University. Importance.

E N D
Global Precipitation Products for Data-Denied Regions Stanley Q. Kidder Center for Geosciences/Atmospheric Research Colorado State University
Importance • Detection of precipitation is critical for the success of military operations. Air operations at sea or over land, mobilization of heavy equipment on third world roads, operation of laser-based systems, and deployment of resources in flood-prone regions all rely on timely and accurate prediction of rainfall events.
History • Because of its importance, precipitation has been estimated from satellite observation since the earliest weather satellites • Two (of many) sources of information about these early attempts: • Barrett, E. C., and D. W. Martin, 1981: The Use of Satellite Data in Rainfall Monitoring. Academic Press, New York. • Kidder, S. Q., and T. H. Vonder Haar, 1995: Satellite Meteorology: An Introduction. Academic Press, San Diego.
Current “Real Time” Precipitation Sources • The University of California Irvine PERSIANN project (Sorooshian et al. 2000) (See http://chrs.web.uci.edu/persiann/) • uses GEO IR and visible imagery in a neural network system to produce global precipitation grids. The PERSIANN system has since been extended to use TRMM, NOAA and DMSP microwave data to “calibrate” higher resolution IR data.
Current “Real Time” Precipitation Sources • The Climate Prediction Center’s CMORPH/QMORPH (Joyce et al. 2004) (See http://www.cpc.ncep.noaa.gov/products/janowiak/cmorph_description.html) • Based on microwave observations calibrated with TRMM data. Uses IR winds to move raining pixels between satellite obervations. QMORPH is the forecaster product, and moves precipitating pixels forward in time to the hour or half hour.
Current “Real Time” Precipitation Sources • CIRA’s Blended Rain Rate (http://cat.cira.colostate.edu) Being developed for operational implementation at NESDIS • Blends data from currently six satellites (see next slide) • Uses a histogram-matching technique to make it appear that all observations are from the same instrument • No motion.
Current “Real Time” Precipitation Sources • NASA Goddard’s TRMM Multi-satellite Precipitation Analysis (TMPA) (Huffman et al. 2007) (See http://precip.gsfc.nasa.gov/index.html) • Combines TMI , AMSR-E, and AMSU-B/MHS microwave measurements. • Gaps are filled using IR data. • No motion • Latency is an issue (~5 hours)
Current “Real Time” Precipitation Sources • The NESDIS Hydro-Estimator (Scofield and Kuligowski, 2003) (See http://www.star.nesdis.noaa.gov/smcd/emb/ff/HydroEst.php) • Uses GEO IR data in a single channel algorithm • GFS model low level humidity estimates to adjust for sub-cloud evaporation over arid regions. • No microwave data are used.
Current “Real Time” Precipitation Sources • The Naval Research Laboratory (NRL) Blended-Satellite Precipitation Technique (Turk and Miller 2005) (See http://www.nrlmry.navy.mil/sat-bin/rain.cgi) • uses GEO IR observations, calibrated using passive microwave observations, plus the microwave observations themselves (when available) to produce 3-hr rainfall accumulations.
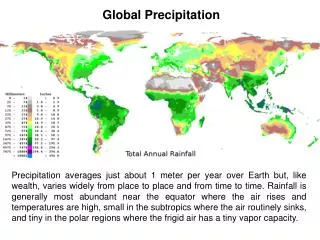
Summary of the Current State • IR provides frequent, high-resolution observations but IR looks only at the outside of the cloud; precipitation must be inferred. • Microwaves view the precipitation-size droplets or crystals inside the cloud, but at lower frequency and resolution. • Current products are mostly aimed at instantaneous rainfall rates, whereas forecasters need accumulated rainfall • To calculate accumulation—given the motion of raining systems—some sort of propagation scheme must be employed
From Kelly Howell’s Thesis TPW might be useful for determining how long precipitation lasts Threshold = 0.1 mm hr-1
What Is Needed • 3 hr accumulations • Short-term forecast (nearcast) • Motion • Orographic enhancement
Blended TPW (mm) and 850 hPa GFS Winds 0 25 50 75 mm 06Z 14 Oct 2009
Terrain Elevation (m) 0 1000 2000 3000 4000
Orographic Rain Index ORI TPW * V•H TPW = Blended Total Precipitable Water advected to product time V = 850 hPa GFS wind vector at product time H = Terrain height V•H terrain-induced vertical velocity ORI moisture * lift Units = mm * m/s
Observed precipitation (inches) 06Z Tue 13 Oct 15Z Wed 14 Oct 0 50 100 150 200 250 + 00Z 14 Oct 2009
Observed precipitation (inches) 06Z Tue 13 Oct 15Z Wed 14 Oct 00Z 14 Oct 2009
Global Precipitation Products for Data-Denied Regions • We propose to develop a blended rain accumulation product which addresses some of these problems. In outline, the product might be constructed as follows: • The instantaneous satellite rain rate observations, both infrared and microwave, would be gathered for an integration period of perhaps three hours. (Though at first only microwave observations would be used.) • The instantaneous observations would be “calibrated” using histogram adjustment to a reference instrument, so that artifacts due to differing instruments would be lessened. • The rain observations would be propagated in time using model winds, and perhaps TPW values, which could possibly be used to estimate changes in intensity of the observed rain rates in time. • Rain accumulations during the analysis period would be calculated for each grid box of the analysis domain. • Terrain induced rain would be added to the accumulations. • Model forecasted rain accumulations could be used to modify/constrain the satellite-estimated accumulations.