Download
1 / 34
340 likes | 408 Views
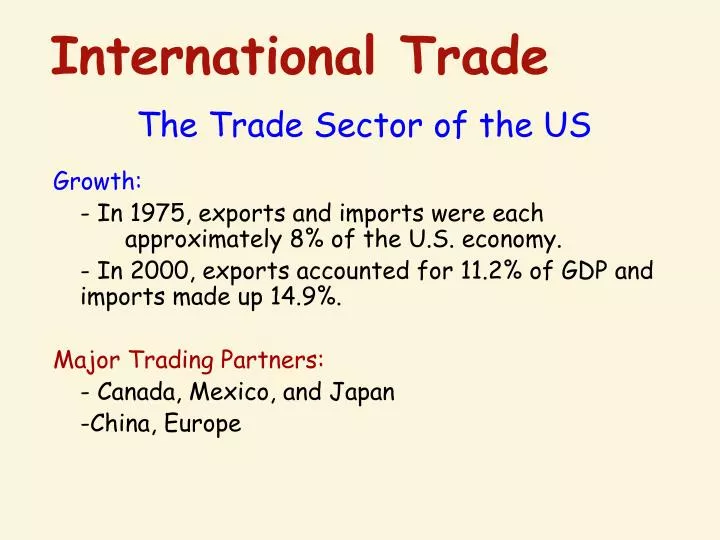
International Trade. The Trade Sector of the US. Growth: - In 1975, exports and imports were each approximately 8% of the U.S. economy. - In 2000, exports accounted for 11.2% of GDP and imports made up 14.9%. Major Trading Partners: - Canada, Mexico, and Japan -China, Europe.

E N D
International Trade The Trade Sector of the US Growth: - In 1975, exports and imports were each approximately 8% of the U.S. economy. - In 2000, exports accounted for 11.2% of GDP and imports made up 14.9%. Major Trading Partners: - Canada, Mexico, and Japan -China, Europe
Imports(% of GDP) Exports(% of GDP) 14.9 % 11.2 % 15 15 10 10 5 5 1960 1970 1980 1990 1960 1970 1980 1990 2000 2000 The Growth of the U.S. Trade Sector • Rapid growth since 1975. • During the 1975-2000 period: • imports rose from 7.5% of GDP to 14.9%, and, • exports rose from 8.3% to 11.2% of GDP. • Reductions in transport and communication costs, as well as lower trade barriers have contributed to this growth. Source: Economic Report of the President, 2002. Table B-2. The figures are based on data for real imports, exports, and GDP. Source: http://www.economagic.com/. The figures are based on data for real imports, exports, and GDP.
The Growth of the U.S. Trade Sector • Both exports and imports have grown substantially as a share of the U.S. economy. • Their growth has accelerated since 1975. • Reductions in transport and communication costs, as well as lower trade barriers have contributed to this growth. Imports(% of GDP) Exports(% of GDP) 15 15 10 10 5 5 1960 1970 1980 1990 1960 1970 1980 1990 2000 2000 Source: http://www.economagic.com/. The figures are based on data for real imports, exports, and GDP.
19.8% 11.9% 18.5% 9.1% 11.5% 8.6% 11.9% 4.9% 7.2% 3.9% 4.5% 3.1% 3.4% 2.5% 2.7% 2.3% 2.1% 1.8% 2.1% 34.4% 32.2% 1.7% Leading Trading Partners of the U.S. –––––––– Percent of Total U.S. Trade, 2002 –––––––– –––––––– Percent of Total U.S. Trade, 2006 –––––––– Canada Mexico China Japan Germany United Kingdom South Korea Taiwan France Malaysia All other countries • Today, Canada, Mexico, China, and Japan are the leading trading partners with the United States. • The impact of international trade varies across industries. --some compete effectively, some do not.
Gains from Specialization and Trade Law of Comparative Advantage • A group of individuals, regions, or nations can produce a larger joint output if each specializes in the production of goods in which it is a low-opportunity cost producer and trades for goods for which it is a high opportunity cost producer.
Gains from Specialization and Trade • International trade allows each country to specialize according to thelaw of comparative advantage. • Each country can produce those goods that it can produce at a relatively low cost. • Trading partners can consume a wider variety of goods than they could produce domestically.
Production Possibilities Bonsai Areca • Guns Butter • 0 • 2 • 4 • 0 6 • Guns Butter • 0 • 12 1 • 2 • 3 • 0 4 Guns Guns Butter Butter
International Example Production Possibilities - Mexico 1 S = __ A 1 A = __ S Production Possibilities - US 1 S = __ A 1 A = __ S US should produce? Mexico should produce? Terms of Trade? ___ A for ___ S
Output per worker day Potential change in output* Food Clothing Food Clothing (1) (2) (3) (4) Country United States Japan * Change in output if US shifts 3 workers from clothing to food industry and if Japan shifts one from food to the clothing. • Columns (1) and (2) show the daily per worker output of the food & clothing industry in the U.S. and Japan. 2 1 + 6 - 3 3 9 - 3 + 9 + 5 + 6 Change in total output • If the U.S. moves 3 workers from clothing to food, it produces 6 more units of food and only 3 fewer of clothing. • If Japan moves 1 worker from food to clothing, it produces 9 more units of clothing and only 3 fewer of food. • With such a reallocation of labor, the U.S. and Japan are able to increase their aggregate output of both food and clothing.
Production possibilities, Japan R Production possibilities, U.S. J1 M US1 S N PPC Before Specialization and Trade • Output of the labor force of both the US (200 million) and Japan (50 million) given the production costs of food and clothing from the previous slide. • In the absence of trade, consumption possibilities will be restricted to points like US1 in the U.S. and J1 in Japan. • Each of these points lay along the production possibilities curve (PPC) of the respective nation. United States Japan Clothing(million units) Clothing(million units) 450 450 400 375 350 300 300 250 225 200 150 150 100 75 50 Food(million units) Food(million units) 100 200 300 400 75 150
O Consumption possibilitiesof Japan with trade Consumption possibilitiesof U.S. with trade T Consumption Possibilities with Trade • Specialization and trade expand consumption possibilities. • If the U.S. trades food for clothing (1-for-1), it can specialize in the production of food and consume along the ON line (rather than its original production-possibilities constraint, MN). • Similarly, if Japan trades clothing for food (1-for-1), it can specialize in the production of clothing and consume any combination along the RT line (rather than its original, RS). United States Japan Clothing(million units) Clothing(million units) R 450 450 400 375 350 300 300 250 M 225 J1 200 150 150 US1 100 75 50 S N Food(million units) Food(million units) 400 100 200 300 400 75 150
250 J2 US2 200 Consumption Possibilities with Trade • For example, with specialization and trade, the U.S. could increase its consumption from US1 to US2, gaining 50 million units of clothing and 100 million units of food. • Simultaneously, Japan could increase consumption from J1 to J2, a gain of 125 million units of food and 25 million units of clothing. United States Japan Clothing(million units) Clothing(million units) R 450 450 O 400 375 350 300 300 250 M 225 J1 200 150 150 US1 100 75 50 T S N Food(million units) Food(million units) 400 100 200 300 400 75 150
Japan exports US imports Japan imports US exports Consumption Possibilities with Trade • How exactly do the U.S. and Japan consume at US2 and J2? • The U.S. produces 400 million units of food, consumes 200 million, and exports 200 million to Japan. • Japan produces 450 million units of clothing, consumes 250 million, and exports 200 million to the U.S.. • They consume more together than they could individually. United States Japan Clothing(million units) Clothing(million units) R 450 450 O 400 375 350 300 300 250 250 M 225 J2 200 US2 150 150 100 75 50 T N Food(million units) Food(million units) S 400 100 200 300 400 150 200
Gains from Specialization and Trade • International trade leads to gains from: • Economies of Scale:reductions in per-unit costs that often accompany large-scale production, marketing, and distribution. • More Competitive Markets:Promotes competition in domestic markets and allows consumers to purchase a wide variety of goods at economical prices.
A Hard Lesson to Learn Exports and Imports are Linked • Exports provide the foreign exchange needed for the purchase of imports. • Imports provide trading partners with the currency needed to purchase exported goods and services. • Therefore, restrictions that limit one will also limit the other.
Sw Price Price Sd Sw c Dw Dd Soybeans (bushels) Soybeans (bushels) U.S. Has a Comparative Advantage • The price of soybeans and other internationally traded commodities is determined by the forces of supply and demand in the world market. • If U.S. soybean producers were prohibited from selling to foreigners, the domestic price would be Pn. • Free trade permits U.S. soybean producers to sell Qp units at the higher world price of Pw. U.S. Market World Market a b Pw Pw Pn Qc Qn Qp Qw
Price Price U.S. exports Soybeans (bushels) Soybeans (bushels) U.S. Has a Comparative Advantage • At the world price of Pw, the quantity (Qp – Qc) is exported. • Compared to the no-trade situation, the producers’ gain from the higher price (Pwb c Pn) exceeds the cost imposed on domestic consumers (Pw ac Pn) by the triangle (area) abc. Sw U.S. Market World Market Sd a b Sw Pw Pw c Pn Dw Dd Qc Qn Qp Qw
Price Price Sd Sw a Dd Dw Shoes Shoes Foreigners Have a Comparative Advantage • Consider the international market for manufacturing shoes. • In the absence of trade, the domestic price would be Pn. • Since many foreign producers have a comparative advantage in the production of shoes, international trade leads to lower prices Pw. U.S. Market World Market Pn Pw Qn Qw
Price Price Sw U.S. imports Shoes Shoes Foreigners Have a Comparative Advantage • At the price Pw, U.S. consumers demand Qc units of which (Qc – Qp) are imported. • Compared to no trade, consumers gain Pna b Pw, while domestic producers lose Pn a c Pw. • A net gain of a bc results. U.S. Market World Market Sd Sw a Pn c b Pw Pw Dd Dw Qp Qn Qc Qw
The Economics of Trade Restrictions
U.S. Tariff Rates: 1890 to the Present –––––––– U.S. Average Tariff Rate –––––––– (Duties collected as a share of dutiable imports) 60% 50% 40% 30% 20% 4.5% 10% 1890 1910 1930 1950 1970 1990 2006
Imports after tariff Tariff =t S U T V Initial imports Trade Restrictions: Impact of a Tariff. • Consider a tariff on autos imports. • Without a tariff, the world price of autos is Pw. At Pw consumers in the U.S. purchase Q1 units … Price SDomestic Qd1 from U.S. producers and … Q1 – Qd1 from foreign producers. • A tariff t makes it more costly for Americans to purchase autos from abroad. U.S. prices rise to Pw+ t and purchases fall from Q1 to Q2. Pw+ t • U.S. purchases from domestic producers rise from Qd1 to Qd2 … Pw imports fall to Q2 – Qd2. DDomestic • Producers gain area S … the tariff generates T tax revenues for the government… Quantity(automobiles) Qd1 Qd2 Q2 Q1 areas U & V are deadweight losses from reduction in allocative efficiency.
Import quota:Q2 – Qd2 S U T V Initial imports Note: The government derives no additional revenue from quotas. Trade Restrictions: Impact of a Quota • Consider a quota on peanuts. • Without trade restraints, Pw(the world price of peanuts) would be the domestic price. At Pw U.S. consumers would purchase Q1 … Price SDomestic Qd1 from U.S. producers and … Q1 – Qd1 imported from abroad. • A quota of Q2 – Qd2 imports pushes the U.S. price up to P2. P2 • While total U.S. purchases fall (from Q1 to Q2), those from U.S. producers rise (from Qd1 to Qd2) and … Pw imports fall to Q2– Qd2. • U.S. producers gain area S. Area T goes to foreign producers with permits to import into the U.S. DDomestic Quantity(peanuts) Qd1 Qd2 Q2 Q1 • U & V are deadweight losses.
Import quota:Q2 – Qd2 Imports after tariff Tariff =t S S U U T T V V Initial imports Initial imports Trade Restriction Impacts Price Price SDomestic SDomestic P2 Pw+ t Pw Pw DDomestic DDomestic Quantity(peanuts) Quantity(automobiles) Qd1 Qd1 Qd2 Q2 Qd2 Q1 Q2 Q1
Why do Nations Adopt Trade Restrictions? • National Defense argument • Self sufficiency argument • Prevents Dumping:a. The sale of goods abroad at a price below cost • b. Allows foreign firms to achieve economies of scale. • c. Foreign firms may want to gain entry to another market. Sell below cost to gain sales. • Infant Industry argument • a. Protect developing industries while growing • b. Difficult to tell when they are adult.
Trade Fallacies • Trade fallacies abound because people often fail to consider the secondary effects. • Key elements of international trade are often linked – you cannot change one element without changing the other. • This is the case with imports and exports; policies that restrain imports also restrain exports.
Trade Fallacies • Trade fallacy 1:“Trade restrictions that limit imports save jobs for Americans.” • This view is false because if foreigners sell less to us they will have fewer dollars with which to buy things from us. • Trade restrictions do not “save” jobs; they merely reshuffle them. Jobs “saved” in protected industries will be offset by jobs “lost” in export industries. • As the result of trade restrictions, fewer Americans are employed in areas where we have a comparative advantage.
Practical Application: • In 2002, the Bush administration imposed tariffs of up to 25% on imported steel products. This action • a. reduced the supply of steel in the domestic market and led to higher steel prices. • b. increased U.S. employment because it saved jobs in the steel industry. • c. reduced employment in the U.S. steel container industry because the higher steel prices made it more difficult for them to compete with foreign rivals.
Trade Fallacies • Trade fallacy 2:"Free trade with low-wage countries, such as Mexico and China, will reduce the wages of Americans." • Both high- and low-wage countries will gain when they are able to focus more of their resources on those productive activities that they do well. • The key to this issue is how will U.S. resources be used. If a low-wage country can supply a good cheaper than we can produce it, the U.S. can gain by purchasing the good from the low-wage country and using its resources to produce other goods for which it has a comparative advantage.
Growth rate Growth rate 1980-2005 1980-2005 Trade Openness, Income, and Growth 10 Least Open Economies, 1980-2002 10 Most Open Economies, 1980-2002 2005 GDPper capita 2005 GDPper capita TOI TOI Hong Kong 10.0 $ 30,989 3.9 % India 4.3 $ 3,072 4.0 % Singapore 9.9 $ 26,390 4.3 % Tanzania 4.1 $ 662 2.3 % Bahrain 8.6 $ 19,112 1.0 % Egypt 4.1 $ 3,858 2.5 % Belgium 8.6 $ 28,575 1.7 % Pakistan 3.9 $ 2,109 2.4 % Malaysia 8.6 $ 9,681 3.6 % Syria 3.8 $ 3,388 0.6 % Luxembourg 8.5 $ 53,583 3.7 % Algeria 3.4 $ 6,283 0.5 % Netherlands 8.4 $ 29,078 1.6 % Sierra Leone 3.4 $ 717 - 1.1 % Taiwan 8.4 $ 20,868 5.1 % Burundi 3.0 $ 622 - 1.0 % Ireland 8.1 $ 34,256 4.5 % Iran 2.9 $ 7,089 1.1 % Australia 7.9 $ 29,981 1.9 % Bangladesh 2.5 $ 1,827 1.2 % Average: 8.7 $ 28,251 3.1 % Average: 3.5 $ 2,963 1.4 % Sources: TOI data are from Charles Skipton, The Measurement of Trade Openness. Doctoral Dissertation, Florida State University, 2003. The per capita GDP and growth data are from The World Bank, World Development Indicators, CD-ROM, 2004. • The income levels and growth rates of the ten most and ten least open economies (as measured by the Trade Openness Index – TOI) are displayed above. • Note that more open economies both achieved higher income levels and grew more rapidly.
Effectiveaveragetariff rate Avg. annual growthrate of real GDP per capita Actual vs. expected sizeof trade sector PPP GDPper capita 1980 1999 1998 1999 1980-1999 Trade Openness, Growth, and Income TOI(80-98) Low trade restrictions: Hong Kong 9.9 1 % 1 % 106 % $ 22,090 3.9 % Singapore 9.8 1 % 0 % 115 % $ 20,767 4.9 % Belgium 9.1 1 % 1 % 49 % $ 25,443 1.7 % Germany 8.5 1 % 1 % 13 % $ 23,742 1.4 % UK 8.5 1 % 1 % - 3 % $ 22,093 1.9 % Netherlands 8.4 1 % 1 % 18 % $ 24,215 1.8 % Luxembourg 8.3 0 % 0 % - 3 % $ 42,769 3.9 % Switzerland 8.0 5 % 1 % - 20 % $ 27,171 0.9 % U.S.A. 7.8 2 % 2 % 0 % $ 31,872 1.9 % Malaysia 7.8 15 % 3 % 286 % $ 8,209 3.7 % Sweden 7.8 1 % 1 % 19 % $ 22,636 1.4 % Ireland 7.7 7 % 1 % 64 % $ 25,918 4.4 % Average: 8.5 3 % 1 % 54 % $ 24,744 2.7 % High trade restrictions: 3.5 31 % 22 % 8 % $ 2,110 3.7 % India 3.4 20 % 17 % - 33 % $ 6,908 0.6 % Brazil 3.3 19 % 9 % - 37 % $ 12,554 0.3 % Argentina 3.2 15 % 24 % - 1 % $ 482 3.3 % Tanzania 3.1 17 % 20 % - 2 % $ 776 - 1.8 % Madagascar 2.9 . 18 % 1 % $ 4,869 - 0.5 % Algeria 2.5 14 % 7 % 9 % $ 3,749 1.1 % Syria 1.9 27 % 32 % - 68 % $ 487 - 3.5 % Sierra Leone Iran 1.9 34 % 18 % - 30 % $ 5,389 - 0.2 % Burundi 1.5 36 % 18 % - 73 % $ 581 - 1.1 % Bangladesh 1.5 27 % 19 % - 27 % $ 1,412 2.4 % Myanmar 0.1 28 % 72 % - 97 % $ 1,200 - 0.1 % Average: 2.4 24 % 23 % - 29 % $ 3,250 0.4 %
U.S. Trade with Canada and Mexico –––––––– U.S. Trade with Canada and Mexico –––––––– (Exports and Imports together as a share of GDP) 6% 5% Canada 4% 3% Mexico 2% 1% 2000 2005 1980 1985 1990 1995 • U.S. trade with both Canada and Mexico grew rapidly following the passage of NAFTA.
Examples Positive IMF - loans and financial assistance GATT / WTO- tariff reductions EU - European free trade area NAFTA - North American free trade area
1. Measured as a share of the economy, the size of the trade sector (exports plus imports) of the United States has a. been increasing since 1980, but it declined during 1960–1980. b. been relatively constant during the last four decades. c. increased by about 10 percent during the last four decades. d. approximately doubled since 1980 and tripled since 1960. 2. A U.S. trade policy that restricts the sale of foreign goods in the U.S. market will a. reduce the demand for U.S. export goods since foreigners will be less able to buy our goods if they cannot sell to us. b. benefit producers in industries that export goods. c. increase the nation’s income since it protects domestic jobs. d. enhance economic efficiency by allocating more resources to the areas of their greatest comparative advantage.