Download
1 / 29
310 likes | 438 Views
Sustainability of Groundwater Use for Irrigation in Northwest Bangladesh. Sustainability ?. Sustainability. R. t. R-Resource use GW use indicates depth of GWT in negative value. Sustainability Indicators. Environmental. Sustain -ability. Social. Economic. Social indicators

E N D
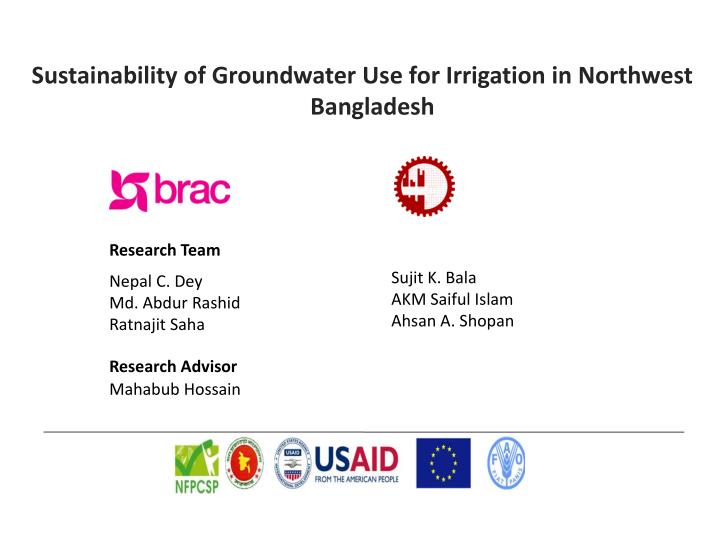
Sustainability of Groundwater Use for Irrigation in Northwest Bangladesh
Sustainability ? Sustainability R t • R-Resource use • GW use indicates depth of GWT in negative value
Sustainability Indicators Environmental Sustain -ability Social Economic • Social indicators • No. of people practicing groundwater recharge methods • No. of people using alternative sources of water for irrigation or other purposes • Peoples’ perception in management • Environmental Indicators • Groundwater table • River water contri. to GW • Precipitation • Groundwater withdrawals • Well intensity • Evapo-transpiration (ET) • Major crops and areas • Wetland area • Change in crop type • Conservation • Economic indicators • Financial Profitability • Economic profitability
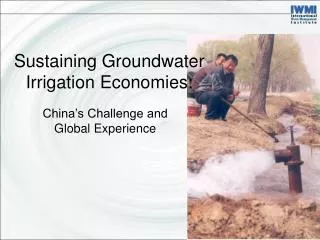
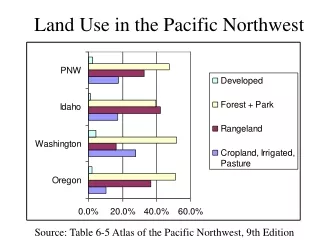
Challenges Withdrawal of GW • Sustainability of GW use for irrigation is becoming a vital concern in many countries of the world, Bangladesh in particular, mainly NW of Bangladesh-where GW declines 5-10m in the dry period (Extracting GW > Recharge capacity) • Contribution of GW for irrigation has increased by 2.5 times after 20 years • Recurrent below-average rainfall, higher temp causing drought, increased ET, delayed monsoon, dry-up of surface water bodies including ponds, rivers and thus lowering of GWT in the aquifer leading water crisis are some important.
Challenges (contd.) • Irrigation cost increased many folds causing threatens the economic viability of future crop production. • Irrigation cost in Bangladesh = > 4times higher than India, 6 times than Thailand and Vietnam. This is mainly because of dependence on GW irrigation • Defects in present IWM practices has been identified. If water is managed properly, BGD can save addl. amount ≈ 1/6 of the total BGD • Budget for FY 2003-4 (USD 8,962 million) (Dey • et al., 2006), and also similar to the ADP budget • of Bangladesh for FY 2009-10 (USD 4072 • million). www.iwaponline.com/wp/00806
Objectives of the study • quantitatively assess the trends in water table depths and crop areas in the designated study area for the past 30 years. • financial and economic profitability of different crops along with likely changes over time due to declining water tables. • recommend policies for sustainable use of irrigation water in northwestern Bangladesh. • In addition, we worked on the following objective- • estimate cost of excess water lifted for irrigation.
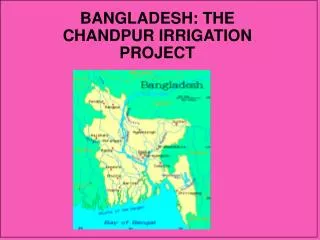
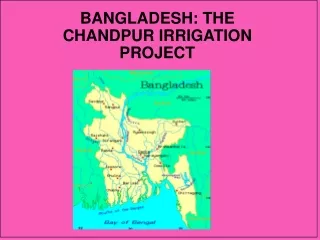
Methodology Study Area Rajshahi, Pabna, Bogra, Rangpur, Dinajpur District of Northwest Bangladesh Geographically, the study area extends 230 48’ 14.3’’ to 260 03’ 16.8’’ latitudes and 880 18’ 44.99’’ to 890 43’ 50.71’’ longitudes. Data Collection • Primary Data and Information • Sample survey through structured questionnaire (Total number of farm household were • 450 where 150 marginal, 150 small and 150 medium/large household) • Focus Group Discussion (Five sub-district from five districts of NW Bangladesh) • Consultation Meeting • Workshop
Secondary Data Data for ET estimation Location: Five Upazilas from five districts in NW region. RS Data: MODIS satellite images & Landsat 7 ETM+ were used in this study. Field coordinates of 131 Boro rice fields located in the selected 5-upazilas were collected using hand held GPS.
Data analysis • Software • SPSS 16.0 and MS Excel • ILWIS 3.4 and Arc GIS 9.2 software for image processing and analysis • Arc GIS 10 - used for mapping. • Financial profitability analysis of major crops : • Formula used ∏ = P1Q1 + P2Q2 - ∑PiXi – TFC • Economic profitability/comparative advantage of major crops: • Border price measured at Farm gate (Import Parity) : Pj = Pjb + Cjm – Cjd • Border price measured at Farm gate (Export Parity): Pi = Pib E0-Ci • Nominal protection (NPC) expressed as: NPCi = Pid/Pib • Effective protection
Comparative advantage of crop production Domestic resource cost (DRC) Estimation of ET Forecasting of irrigation cost Autoregressive Integrated Moving Average or ARIMA (p,d,q) models used. An AR(p) model has the form: Yt = a1Yt-1 + … + apYt-p + et SEBAL and FAOPenman-Moneith : Where, Go – Soil heat flux, W.m-2 H – Sensible heat flux, W.m-2 λE – Latent heat flux, W.m-2 associated with ET FAO Penman-Monteith method Figure : Components of the Energy Balance
Normalized Differentiate Vegetation Index (NDVI) Map ET + + Estimation of Excess Water Precipitation Excess Water GoB-BRAC weather station for climatic data Vegetation indices over NW region
Result and Discussion Groundwater table depths • Declining trend of GWT overtime Fig . Changes in depth of GWT depth (Jan-May) over time. Name of depleted upazilas: Fig . Map of depleted upazilas in five districts
River water level • RWL (Yearly avr.) • 20.1m • 18.3 m Fig. Northwest region river water level fluctuation (yearly avg.) River water discharge • RWD (Yearly avr.) • 90.8 • 56.9m3/sec Fig. Changes in river water level (a- maximum, and b-minimum) Fig. Relationship between RWL & GWT
Changes in crop areas • 10 major crops’ area has increased 31915 (hectare) where boro alone increased more than 9 times during 1980/81 to 2009/10. Figure (a-e). Change in crop area over time at (a) Rangpur; (b) Dinajpur; (c) Rajshahi; (d) Pabna and (e) Bogra district
Financial profitability of Five major rabi season crops Figure: Cost and return of different crops cultivation Figure: Farm Category wise Benefit Cost Ratio of Boro Rice Figure: Region wise Benefit Cost Ratio of Boro Rice
Major Cropping Patterns and suggested crops in the study area
Actual and projected irrigation cost (Tk/ha) Simulation of time path of boro rice production cost and GWT depth 1
Using forecasted irrigation cost (other things reaming same) the financial and economic analysis of boro rice
NDVI Changes of NDVI and ET in 2010 21 January 11 April ET 11 April 21 January ET estimated by SEBAL and Penman-Monteith methods.
Intensity of TW Fig. b) Increase of TW over time Fig.(a) Intensity of TW • TW intensity: 6.9 to 36 nos/ km2 • DTW became almost double • STW reached more than five time higher • TW increased 8.5 times where irrigated land increased 1.6 times. Fig.(c) Increase of irrigated area over time
Excess water extracted Fig. Water requirement & Excess water lifted Amount extracted was highest in Badarganj of Rangpur district followed by Godagari of Rajshahi, Birampur of Dinajpur, Chatmohor of Pabna district, and least in Dhupchancia of Bogra district Fig. NW region Irrigation water requirement and extraction
Environmental Impact 12464.8T (2010) OC N S K Zn 3895 T (‘73-90) P Nutrient mining Pesticides use Polluted water percolation Saline water intrusion
Socio-economic impact Nutrition deficiency Jobless Time and Energy loss for collecting water Economic loss from pisciculture - drought Health problems
Policyrecommendations 1. To harmonize boro rice cultivation with other high valued winter crops. 2. Managed Aquifer Recharge (MAR) should be undertaken as a national programme and strategy considering different regional contexts by adopting a series of activities like harvesting of surface and rain water and their storage and conservation through excavation of existing canals, ponds, khals, and water bodies in massive scale. 3. To establish independent Water Regulatory Authority (WRA)/Groundwater Directorate (DR) or any other existing bodies like BADC, DAE might be used for establishing governance and management of groundwater resource to fix and regulate the water tariff system and charges as per Policy Framework. 4. Water User Association (WUA) rooted strong small holder irrigation community should given statutory powers to fix rate determined by WRAs/badc/dae. 5. Optimization of command area of each DTW and STW though consultation with Water User Association where electric connection to pumps is the key component for regulation on GW use and to be realized phase wise i.e., with short term, medium term and long term planning. 6. Irrigation water price should be determined as a rule on volumetric basis in order to meet equity, efficiency and economic principles.
Policy recommendations (contd.) 7. Modern water Management technology liker alternate wetting and drying (AWD), water saving technology like hose pipe irrigation, drip irrigation, drought tolerant crop variety, etc. would bear no value without carrying out irrigation volumetrically. 8. Plan of Action (PoA) in line with basic policies like NAP, PRSP, CIP, NAPA, etc might be formulated under proposed GD or WRA or exsisting BADC or DAE on short term (ST), medium term (MT) and long term (LT) basis. 9. National Sustainable Development Strategies by the government is a good effort to achieve sustainability in all developmental activities specially GW resources of the country under one umbrella. 10. Global Best Management Practices on GW might work as guidelines for going into action for the GW management of the country.
If water is not managed properly, Days are coming when - possibilities of