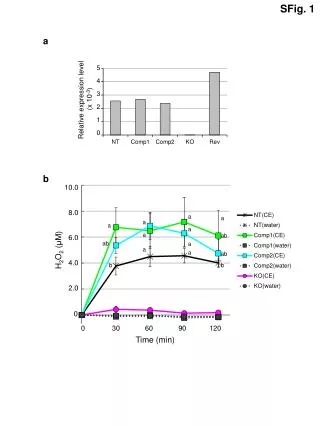
Download
1 / 5

E N D
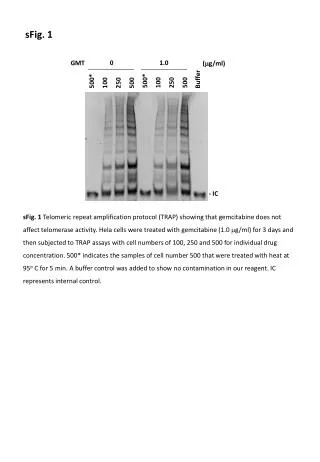
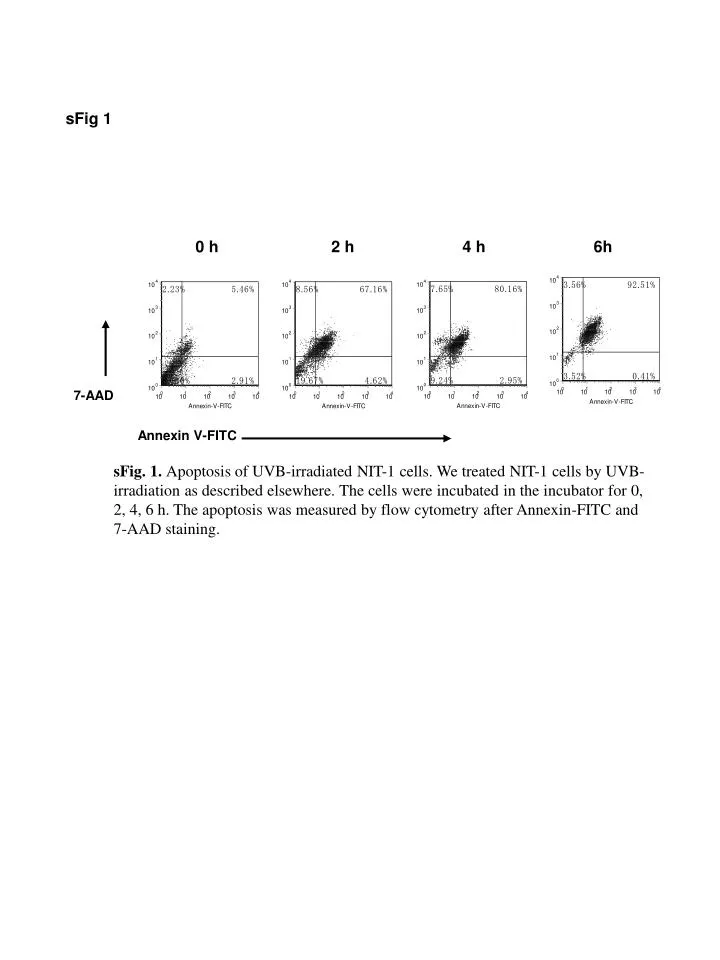
0 h 2 h 4 h 6h 7-AAD Annexin V-FITC sFig 1 sFig. 1. Apoptosis of UVB-irradiated NIT-1 cells. We treated NIT-1 cells by UVB-irradiation as described elsewhere. The cells were incubated in the incubator for 0, 2, 4, 6 h. The apoptosis was measured by flow cytometry after Annexin-FITC and 7-AAD staining.
Insulin B9-23 Medium CD4-PE CFSE sFig 2 sFig 2. T cell proliferation stimulated by insulin B9-23. NOD spleen cells were stained with CFSE (5 M). CFSE-labeled spleen cells (2 106) were stimulated with or without insulin B9-23 (12.5 M) for 3 days. Thereafter, the cells were stained with anti-CD4-PE. The cell divisions in CD4+ and CD4- T cell populations were analyzed by flow cytometry.
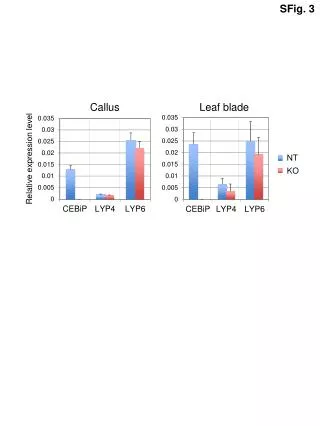
sFig 3 A B sFig 3. UVB-NIT1 treatment induces beta-cell antigen-specific regulatory T cells. A. We treated 10-week old NOD mice with 3 weekly transfusions of UVB-NIT1 or PBS (2 mice in each group). Thereafter, we challenged all the mice with intraperitoneal injection of NIT1 lysates and adjuvant once a week for 2 weeks. The following week, splenocytes were prepared, and CD4+CD25+ T cells were isolated from the pooled splenocytes of two animals from each treatment group. Purified CD4+ T cells (1x10⁶) from naïve 8-week old NOD mice were cultured with 2x10⁵ of purified CD4+CD25+ T cells from UVB-NIT1-treated or PBS-treated mice in a U-bottom 96-well plate. At the same time, The purified CD11c+ splenic dendritic cells (1x10⁵) and 12.5uM insulin B9-23 peptide were added to each well. The cells were cultured for 5 days, then, 3H-thymidine (1uCi/well) was added to each well for additional 16h. The cell proliferation was determined by scintillation counting) B. The pancreatic lymph nodes were collected from each animals from the above experiment. The lymph node cells were prepared. The lymph node cells (5x10⁵) were stimulated with 12.5uM insulin B9-23 peptide for 5 days, the proliferation of T cells stimulated by insulin B9-23 was determined using 3H-thymidine incorporation assay as described above. Triplicate wells were used for all the cultures.
sFig 4 sFig 4. The cytokine production by T cells in response to NIT-1 lysate stimulation. The spleen cells (1 106 ) from the mice for the experiment shown in sFig 3 were stimulated with insulin B9-23 (12.5 M) or 50 g/ml of NIT-1 lysates in 200 l culture medium for 5 days. The cytokines, IL-4, IL-10 and IFN- were measured by Luminex. The similar cytokine-producing patterns were obtained by the stimulations of insulin B9-23 and NIT-1 lysates.
Supplemental table 1: The comparison of MFI by flow cytometry and Index by RIA assay for anti-β cell Abs UVB-NIT1-treated group PBS-treated group Animal # MFI RIA (Index) * Animal # MFI RIA (Index)* 1 1.7 2.5 1 6.1 26.3 2 1.9 5.9 2 8.7 66.7 3 1.9 5.5 3 4.4 15.3 *: The samples with RIA index>=9.8 in this experiment are designated to be positive (For mouse IAA assay by RIA, see reference: Yu L, Eisenbarth G, Bonifacio E, Thomas J, Atkinson M, Wasserfall C. Ann N Y Acad Sci. 2003 Nov;1005:1-12 )