Download
1 / 9
90 likes | 216 Views
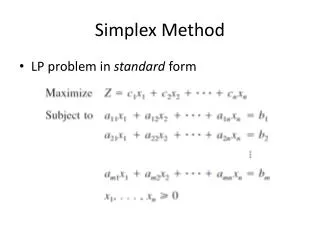
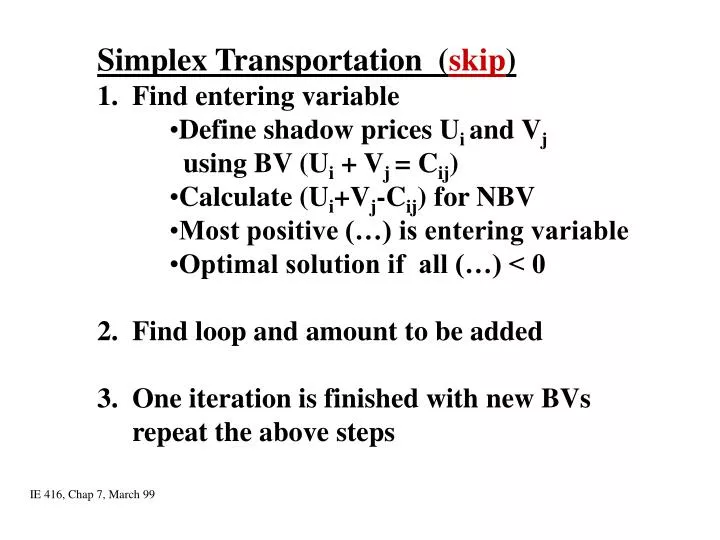
Simplex Transportation ( skip ) 1. Find entering variable Define shadow prices U i and V j using BV (U i + V j = C ij ) Calculate (U i +V j -C ij ) for NBV Most positive (…) is entering variable Optimal solution if all (…) < 0 2. Find loop and amount to be added

E N D
Simplex Transportation (skip) • 1. Find entering variable • Define shadow prices Ui and Vj • using BV (Ui + Vj = Cij) • Calculate (Ui+Vj-Cij) for NBV • Most positive (…) is entering variable • Optimal solution if all (…) < 0 • 2. Find loop and amount to be added • 3. One iteration is finished with new BVs • repeat the above steps IE 416, Chap 7, March 99
Shadow price: (skip) • Ui for row and Vj for column • Always U1 = 0 • Use BV cells (Ui + Vj = Cij) to find all Ui and Vj U1 = 0 IE 416, Chap 7, July 99
Optimality condition: (skip) • For all NBV cells (Ui + Vj - Cij) =< 0 IE 416, Chap 7, July 99
Loop: A rectangular shape with only one NBV cell in one corner and BV cells in all other corners. IE 416, Chap 7, July 99
Transportation Sensitivity Analysis • Changes in the unit cost of shipment (Use software) • CNBV • CBV • Changes in the capacity of supply or demand points (Use software) • Si • dj • Changes in the capacity of supply and demand points (manually) • Si and dj for a BV cell • Si and dj for a NBV cell IE 416, Chap. 7, Sept 2009
Some Questions on • Transportation Sensitivity Analysis • Determine the range of values of the unit • cost of shipment for which the current • basis remains optimal? • How does a change in the capacity of • demand and supply points affect the • optimal solution? IE 416, Chap 7, July 99
An Example of Change in si & dj for BV: s2 & d3 IE 416, Chap 7, July 99
An Example of Change in si & dj for NBV: s1 & d3 IE 416, Chap 7, July 99
Sensitivity Analysis Options for Transportation • Using WinQSB: • Range of Optimality: Provides information on possible changes in coefficients of objective function (unit cost of shipment) so that having the same solution (Xij, bfs) but with different minimum cost. • Range of Feasibility: Provides information on possible changes in capacities of supply or demand points so that having the same basis (ship from one node to the other) but with different amount of shipment and minimum cost. • Perform Parametric Analysis: Provides sensitivity analysis (and graph) on a cost of unit shipment, capacity of a demand point, or capacity of a supply point. • Manually: • Can find range of possible changes in the capacity of a supply and demand point at the same time. IE 416, Chap 7, Sept. 2009