Download
1 / 47
470 likes | 623 Views
Usability of Multi-modal Home Health Monitoring Devices Used By Older Adults Rita Hubert Pace University April 12, 2008. Essence of the Idea. Usability of Home Health Monitoring Devices Used by Older Adults. Aging Population Statistics.

E N D
Usability of Multi-modal Home Health Monitoring Devices Used By Older Adults Rita Hubert Pace University April 12, 2008
Essence of the Idea Usability of Home Health Monitoring Devices Used by Older Adults
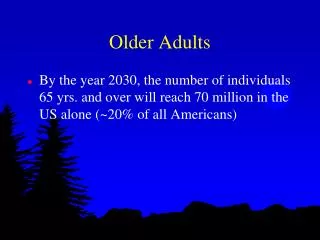
Aging Population Statistics The number of persons age 65 and over is expected to more than double to 71.5 million by 2030. [Administration on Aging, United States Department of Health and Human Services, “Profile of Older Americans: 2004]
Care Giver Shortage Fewer workers will be available to care for the aging population. [Department of Health and Human Services, “The Future Supply of Long-Term Care Workers in Relation to the Aging Baby Boom Generation”, May 14, 2003.]
Increased Need for Long Term Health Care Workers It is projected that between 2000 and 2010 there will be a need for 70% more health care workers in the home health care industry. [Department of Health and Human Services, “The Future Supply of Long-Term Care Workers in Relation to the Aging Baby Boom Generation”, May 14, 2003.]
United States Healthcare Spending Projections Medicare spending was $252.2 billion in 2002 and is projected at more than $500 billion by 2012. [California HealthCare Foundation, “Snapshot Health Care Costs 101”, www.chcf.org, 2005]
United States Health Information Technology Spending • Organization of Economic Co-operation and Development (OECD) Statistics for Health Information Technology Spending as of 2005 including: • Electronic Medical Records • Telehealth • Electronic Ordering Systems • Decision Support Tools • Networks and Infrastructure [Health Care Spending and Use of Information Technology in OECD Countries, Health Affairs, Vol 25, No 3, pp 819-831, 2006]
Older Adults with Chronic Diseases • Chronic Disease examples: • Heart disease • Hypertension • Asthma • Chronic Obstructive Pulmonary Disease (COPD) • Chronic Diseases account for 95% of the health care spending for older adults. • 80% of older Americans have 1 chronic disease • 50% of older Americans have 2 chronic diseases • The average person 75 years of age has 3 chronic diseases. • Chronic Diseases are the leading cause of death in America. • Diabetes • Stroke • Arthritis [Centers for Disease Control, Health and Human Services,”The State of Aging and Health in America 2004”, www.cdc.gov/aging/pdf/state_of_Aging_and_Health_in_America_2004.pdf]
Relevance and Significance of the Research • Home health monitoring devices will provide older adults with the ability to live independently at home longer while under the care of the health provider. • Home health monitoring devices will reduce the need for caregivers and reduce costs. • The Kaiser Permanente Tele-Home Health Research Project found mean cost savings of $726 in the home health monitoring group. • New England Healthcare Institute and Massachusetts Technology Collaborative reports that studies show an annual costreduction of $7,830 per patient per year for congestive heart failure and $747 per patient per year for diabetes with the use of home health monitoring devices. • The Pennsylvania Home Care Association study found that with home health monitoring devices, each nurse could care for 6 more patients, 17 rather than 11.
Definition: Home Health Monitoring Home Health Monitoring or TeleMonitoring • the use of technology devices in the home • the collection of health parameters by the patient • the transfer of the data to a remote monitoring station • healthcare provider review and actions Some devices, not studied in this research, use videoconferencing and stethoscopes.
Home Health Monitor Measures • Weight • Device 1 and Device 2 use a scale • Blood Pressure/Pulse • Device 1 and Device 2 use a Blood Pressure Cuff (Device 2 uses a separate machine with a separate ‘start’ button) • Temperature • Device 1 uses a temperature sensor probe. • Device 2 uses manual data entry of temperature measure performed with home thermometer • Blood Oxygen Saturation • Device 1 and Device 2 use a finger sensor clip • 6 Health Questions • Device 1 uses both visual and auditory interaction for the questions. • Device 2 uses only visual interaction for the questions.
Schema and Positioning of Telemedicine Segments [adapted from Dan and Luprano, 2003] Teleoperation High Telediagnostic Teleconsulting Medical Complexity E-learning Telemonitoring Tele- meeting Low Commercial Development Research Technology Maturity Level
Definition: Usability • Usability is the study of the interaction between a computer-based device and the user of the device. • ISO 9241 Usability Standard - Usability is the effectiveness, efficiency and satisfaction. • Jakob Nielsen considers usability characteristics as being easy to use, easy to learn and easy to remember.
Home Health Monitor Device Multi-modal Usability Factors Multi-modal Usability Factors • Audio • Male or Female voice • Volume adjustable • Languages available • Visual • Text size • Color • Contrast • Button size • Button spacing
Usability Methods According to Jakob Nielsen [Nielsen, Jakob, Usability Engineering, Morgan Kaufman, Academic Press, 1993]
Healthcare Monitoring Usability Studies • Telephone-Linked Care for Diet Adherence in Dyslipidemia (2004) • Method: telephone interviews and laboratory observation • Sample size: 8 • Home Asthma Telemonitoring System (2004) • Method: telephone interviews and home-based field observation • Sample size: 5 • Informatics for Diabetes Education and Telemedicine (2003) • Method: cognitive walkthrough and home-based field study observation • Sample size for the field study observation: 25 • Diabetes Glucometer (2001) • Method: Survey and laboratory observation • Sample size: 26 for the survey and 6 for the observation
Lessons Learned From Older Adult Research • Use individual interviews, rather than paper questionnaires or focus groups. • Eliminate the use of ‘don’t know’ . • Obtain Qualitative data via open ended questions about feelings, problems and experiences with technology. • Conduct in-home interviews to learned the most and see how the technology fits into home. • Older Adults are concerned about user friendliness of devices. • Use a video and audio tape recorder to record the tester using the device because it is easier to do transcripts from audio tape recordings • Let seniors try technology and ask questions in a supported environment • In-home studies provide a realistic setting for testing home health monitoring devices
Technology and Older Adult Research - Representative Sample Size [Syme, Audrey and Roos Eisma, “How Representative is Your Older Adult Sample?”, HCI and the Older Population, Leeds, UK, September 7, 2004.]
Research Study Phases Phase 1 Semi-structured Telephone Interviews • 21 experienced Participants Phase 2 Audio and Video Recording Observations for Device 1 Usage • 7 Experienced Participants • 10 Inexperienced Volunteers Phase 3 Audio and Video Recording Observations for Device 1 and 2 Usage • 10 Volunteers
Study Audience • Older Adults between 50 and 88 years of age. • Both males and females. • Older adults living in rural New Hampshire. • The Test Group • 21 current and former Visiting Nurse Association patients who used a home health monitoring device for more than 7 days. • The Control Group • 10 volunteers with no previous experience using home health monitoring devices.
Qualitative Research Methods • Usability Method • Semi-structured Telephone Interview • Qualitative Measures • Satisfaction • Comments • Sample size • 21
Quantitative Research Methods • Usability Method • Field Study Observation in the Older Adult Home using audio and video recording • Quantitative Measures • Time to complete each task • Time to complete each sub-task • Number of Errors • Sample size • 19 • Study group = 7 • Control group = 12
Institutional Review Board (IRB) Process • Definition: • ‘An institutional review board (IRB) is a Committee that has been formally designated to approve, monitor, and review biomedical and behavioral research involving humans with the alleged aim to protect the rights and welfare of the research subjects. An IRB performs critical oversight functions for research conducted on human subjects that are scientific, ethical, and regulatory.’ [Wikipedia] • Pace University IRB Approval is required before beginning any Research with Human Subjects. • Obtain Certificate on Human Subjects Research History, Ethics and Requirements • Complete the IRB Form • Obtain IRB Approval • Update IRB and obtain Approval for any Changes in Research and Subjects • Close IRB for your Research
Phase 1 - Participant Statistics Phase 1 Home Health Monitoring Study – Semi-structured Telephone Interview • Study Statistics • Ages:Number: Gender: • 50-59 6 4F 2M • 60-69 2 2F • 70-79 8 2F 6M • 80-89 5 3F 2M 11 Females 10 Males • Total 21 Participants • 21 participants or 100% wear glasses • 2 participants or 9.5 % wear hearing aid
Phase 1 - Satisfaction with Home Health Monitor Device 1 Used by Patients Overall Satisfaction with the home health monitoring device by Patients ResponsePercentage • Very satisfied 16 76% • Satisfied 4 19% • Dissatisfied 0 • Very dissatisfied 1 5%
Phase 2 - Satisfaction with Home Health Monitor Device 1 Used by Volunteers Overall Satisfaction with the home health monitoring Device 1 by Volunteers NumberPercentage • Very satisfied 8 80% • Satisfied 2 20% • Dissatisfied 0 • Very dissatisfied 0
Phase 3 - Satisfaction with Home Health Monitor Device 2 Used by Volunteers Overall Satisfaction with the home health monitoring Device 2 NumberPercentage • Very satisfied 5 50% • Satisfied 4 40% • Dissatisfied 1 10% • Very dissatisfied 0
Phase 1 – Device 1Visual and Button Comments • Button on top would be better. (T4) • Can not read text but do by color. (T6) • Buttons are too close together. Son’s finger pushes two buttons at a time. (T7) • Buttons are flat and too close together. Unable to feel different buttons. Need texture on some buttons to differentiate. Need better contrast, such as black machine and white buttons. (T10) • When you push the button you need to feel the push, so you know if you pushed enough. Display not large enough to see clearly. (T17) • Buttons difficult to use with long finger nails. Raised button would be better to use rather than flat button. (T18) • The buttons are difficult to push on front of machine, must put hand on top and push button. (T20)
Phase 2 – Device 1 Volunteer Visual and Button Comments • Move buttons on top of machine (V9) • Pushing the ‘Start BP’ button with blood pressure cuff on one arm and oxygen sensor on the finger of the other hand is difficult. Move buttons to top of machine. (V1) • Angle of display is difficult. (V5) • Do not like looking down on screen. Did not like the colors, they were hard to read. Suggest black buttons on white background. (V4) • The angle of the screen on front of the machine is difficult. LED is easier to read. (V6)
Phase 3 – Device 2Visual and Button Comments • Start BP button easy (V10) • Circular buttons are easy. Separate button for BP is confusing. (V11) • Clear visual screen. Directions are simple to follow. (V12) • Selection buttons are easy. (V5) • Buttons are easy. (V3) • Easy visible screen and buttons. (V7) • Button and the meaning of the scroll on the side of screen is difficult. Circular scrolling with arrow buttons should be provided. (V9) • Not separate start BP reading button. (V8) • Cancel and OK buttons use is difficult. (V3) • Reading screen is easy. (V6)
Hypothesis 1. Previous computer experience will decrease task time, regardless of age. 2. Previous computer experience will decrease error rate, regardless of age. 3. Persons with previous experience using the device will have faster task times than new users. 4. User device satisfaction ratings will be high for devices with low task times. 5. User device satisfaction ratings will be high for devices with low button press error rates 6. Discomfort with computers and technology results in longer performance task times for older adults. 7. Participants less than 65 years of age require less time to complete 6 health related questions than the participants over age 65
Phase 2 – Patients versus Volunteer Using Device 1 Summary Results
Phase 3 – Volunteers Using Device 1 and Device 2 Summary Results
Hypothesis 1Previous computer experience will decrease task time responding to questions, regardless of age. • Using Device 1 the average time for responding to 6 health related questions for test and control group participants • The computer experienced group completed the task an average of 24% faster than the computer inexperienced group. • The chi-squared test shows no significant difference between the computer experience and no computer experience group. • p=0.293763221
Device 1 More Experienced versus Less Experienced Test Group Task Time Comparison Summary: The most experienced persons were 21 and 33 seconds. The most inexperienced person was the longest with 49 seconds. A larger sample size is needed to evaluate the statistical significance.
Hypothesis 2Previous computer experience will result in a decreased error rate, regardless of age. • Summary: One experienced computer user had 11 errors and the remaining 5 computer users had a total of 8 errors. • A larger sample size is recommended to more accurately consider the comparison for this hypothesis.
Hypothesis 3Computer Experience versus Computer Inexperience Persons with experience using the device will have faster task times than inexperienced users. • The similarity of the task times shows that the usability of Device 1 is good because responding to 6 health related questions for Device 1 is easy to learn and use.
Hypothesis 4User Overall satisfaction ratings will be high for devices with low task times • The task time in seconds to respond to 6 health related questions by 12 volunteers. Ten volunteers used Device 1 and ten volunteers used Device 2 • Chi squared show significant differences at p value of less that 0.01 • Task time in seconds for the same 8 volunteers using Device 1 and • Chi squared show significant differences at p value of less that 0.01 • Overall Device Satisfaction of the participants with Device 1 and Device 2 • There is no statistical significance and the results are therefore similar. • Although the Device 2 participants required significantly longer times to complete the responses to 6 health related questions, their satisfaction ratings show similar ratings.
Hypothesis 5User Button Ease of use satisfaction is high for devices with low button error rates. • Comparing Device 1 and Device 2 total button press error rate for volunteers using vital signs and 6 health related questions. • The person with 11 button press errors indicated the buttons were easy to use. The person with 7 button press errors indicated the buttons were very easy to use. The person with 4 button press errors indicated the buttons were difficult to use. • The CHI-squared comparison of the button press errors is highly significant p = less than 0.01 • The comparison of the responses of the button ease of use question shows no significance.
Hypothesis 6 Computer Comfortable versus Computer Uncomfortable Participant Task Time Comparison Summary: A larger sample size is needed to evaluate the statistical significance.
Hypothesis 7 Younger versus Older Groups Task Time Comparison Summary: The range of the results and average task time are lower for the less than 65 age group in comparison to the greater than 65 age group. However, a larger sample size is needed to evaluate the statistical significance.
Device 1 - Recommendations • Good use of bright primary colors • Good use of multi-modal visual and auditory interaction • Move buttons to the top of the device • Use more spaces between the buttons • Use raised buttons with different textures • Use raised buttons with louder auditory feedback when pressing • Use thicker high contrast letters and numbers on the monitor screen
Device 2 - Recommendations • Good screen location and angle for viewing • Good primary Button location, size and spacing • Button color should use bright primary colors • Contrast should be improved on the monitor, especially the number pad (gray background with gray buttons) • Use raised buttons with different textures • Use raised buttons with louder auditory feedback of pressing • Use thicker high contrast letters and numbers on the monitor screen • Add auditory reading for the health questions, in addition to visual question on screen • Use more auditory directions, if no patient response • Repeat messages several times, if no patient response
Summary Button Recommendations • Button Location/Spacing – • On top of machine or on an angle screen rather than on the front of the machine • Space between buttons to avoid double button press or incorrect button press • Button visual- • Button color – bright colors • Button contrast - high contrast with background color • Button text color – color bright • Button text contrast – high contrast with background color • Button Auditory – • Button auditory feedback for button pressing • Button Tactile – • Button texture – different for each button for visually limited persons to differentiate buttons by texture • Button tactile feedback upon pressing • Raised button to differentiate from device • Button Operations – • Minimize the number of buttons • Minimize the number of button presses
Future Work • Larger Sample Size • Include more Males in the Observational group. • Inclusion of more Home Health Monitoring Devices • Conduct Satisfaction Rating and Device Interview after all Devices are Tested • Interview Home Health Monitoring Nurses • Interview Physicians who recommend patients for Home Health Monitoring • Setup Camera on Tripod in Home and ask Patients to do their own recording.
Experience-Based Recommendations • Keep Focused on your Research • Ask • If you need IRB Approval, Apply ASAP • Apply and Present at a Conference Doctorial Consortium • Set and Meet Short-term Goals • Push Yourself • It is definitely worth the effort
References [1] Dan, Jean-Pierre and Jean Luprano, “Homecare: A Telemedicine Application” Medical Device Technology, December 2003, www.medicaldevicesonline.com, pp.25-27. [2] Farzanfar, Ramesh, Joseph Fingelstein, Robert Friedman, “Testing the Usability of Two Automated Home-based Patient-Management Systems”, Journal of Medical Systems, Vol 28, No 2, April 2004, pp. 143-153. [3] Goodman, Joy, Stephen Brewster, and Philip Gray, “Older People, Mobile Devices and Navigation”, HCI and the Older Population, Leeds, UK, September 7, 2004, www.acs.gla.ac.uk/utopia/workshop/. [4] Health Care Spending and Use of Information Technology in OECD Countries, Health Affairs, Vol 25, No 3, pp 819-831, 2006 [5] Home Care Automation Report, “Telemedicine Leaders Recognize Home Telehealth”, vol 10, no 8, pp. 5-6, August 2005 [6] Johnston, B, L Wheeler, J Deuser, and K Sousa, “Outcomes of the Kaiser Permanente Tele-home Health Research Project”, Archives of Family Medicine, vol 9, no 1, 2000, pp 40-45. [7] Kaufman, David, Vimla Patel, Charlyn Hilliman, Philip Morin, Jenia Pevzner, Ruth Weinstock, Robin Goland, Steven Shea, and Justin Starren, “Usability in the real world: assessing medical information technologies in patients’ homes”, Journal of Biomedical Informatics, vol 36, pp 45-60, 2003. [8] Klecun-Dabrowska, Ela and Tony Cornford, “Evaluation and Telehealth-An Interpretative Study”, Proceedings of the 34th International Conference on System Sciences, pp 1-10, 2001.New England [9] Healthcare Institute, “Advanced Technologies to Lower Health Care Costs and Improve Quality”, Massachusetts Technology Collaborative, http://www.nehi.net/, Fall 2003. [10] Oorni , Kai, “What do we Know about Usability Evalation? A Critical View”, www.student.oulu.fi/~koorni/digilib2003.pdf, 2003 [11] Pennsylvania Homecare Association and Pennsylvania State University, “The Financial Viability of Telehealth and Telehealth’s Impact on Home Health Nurses” Telehealth Project Evaluation – Year 3, September 1, 2004 – August 31, 2005. [12] Rogers, Wendy, Amy Mykityshyn, Regan Campbell and Arthur Fisk, “Analysis of a ‘Simple’ Medical Device”, Egonomics in Design, (Winter 2001) 6-14.