Download
1 / 12
120 likes | 374 Views
Clustering. Clustering of data is a method by which large sets of data is grouped into clusters of smaller sets of similar data. The example below demonstrates the clustering of balls of same colour. There are a total of 10 balls which are of three different

E N D
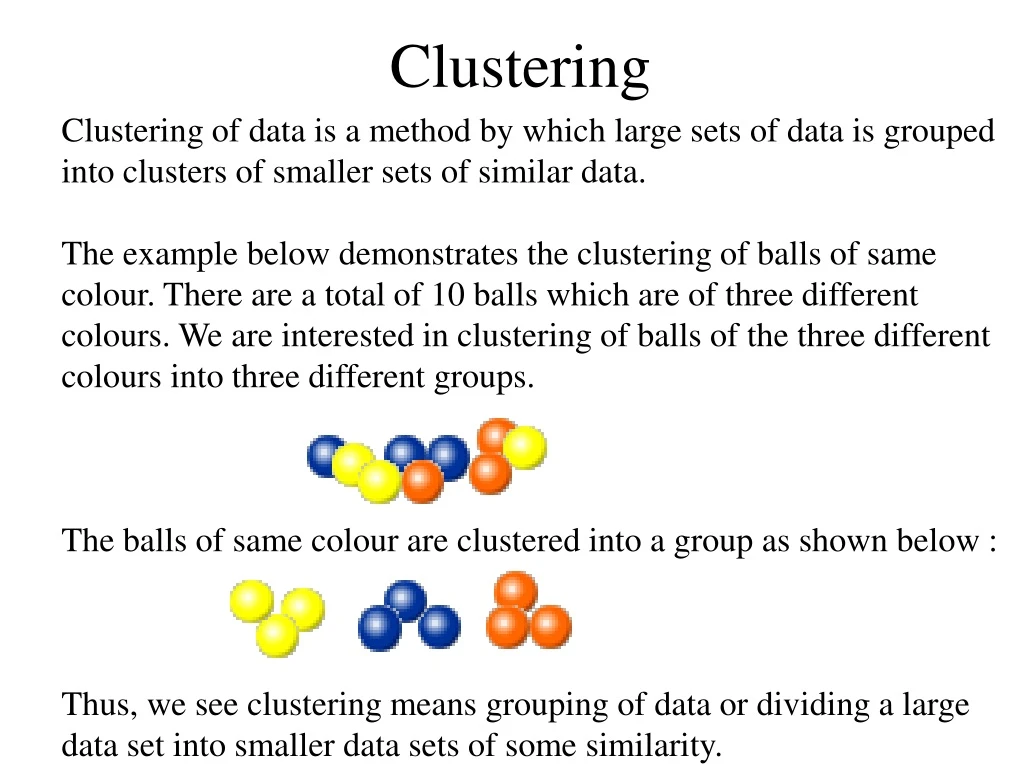
Clustering Clustering of data is a method by which large sets of data is grouped into clusters of smaller sets of similar data. The example below demonstrates the clustering of balls of same colour. There are a total of 10 balls which are of three different colours. We are interested in clustering of balls of the three different colours into three different groups. The balls of same colour are clustered into a group as shown below : Thus, we see clustering means grouping of data or dividing a large data set into smaller data sets of some similarity.
Clustering Algorithms A clustering algorithm attempts to find natural groups of components (or data) based on some similarity. Also, the clustering algorithm finds the centroid of a group of data sets.To determine cluster membership, most algorithms evaluate the distance between a point and the cluster centroids. The output from a clustering algorithm is basically a statistical description of the cluster centroids with the number of components in each cluster.
Cluster Centroid and Distances Cluster centroid : The centroid of a cluster is a point whose parameter values are the mean of the parameter values of all the points in the clusters. Distance Generally, the distance between two points is taken as a common metric to as sess the similarity among the components of a population. The commonly used dist ance measure is the Euclidean metric which defines the distance between t wo points p= ( p1, p2, ....) and q = ( q1, q2, ....) is given by :
Assign a distance measure between data Find a partition such that: Distance between objects within partition (I.e. same cluster) is minimized Distance between objects from different clusters is maximised Issues : Requires defining a distance (similarity) measure in situation where it is unclear how to assign it What relative weighting to give to one attribute vs another? Number of possible partition us superexponential Distance-based Clustering
Basic Ideas : using cluster centre (means) to represent cluster Assigning data elements to the closet cluster (centre). Goal: Minimise square error (intra-class dissimilarity) : = Variations of K-Means Initialisation (select the number of clusters, initial partitions) Updating of center Hill-climbing (trying to move an object to another cluster). K-Means Clustering This method initially takes the number of components of the population equal to the final required number of clusters. In this step itself the final required number of clusters is chosen such that the points are mutually farthest apart. Next, it examines each component in the population and assigns it to one of the clusters depending on the minimum distance. The centroid's position is recalculated everytime a component is added to the cluster and this continues until all the components are grouped into the final required number of clusters.
1) Select an initial partition of k clusters 2) Assign each object to the cluster with the closest center: 3) Compute the new centers of the clusters: 4) Repeat step 2 and 3 until no object changes cluster K-Means Clustering Algorithm
Hierarchical Clustering Given a set of N items to be clustered, and an NxN distance (or similarity) matrix, the basic process hierarchical clustering is this: 1.Start by assigning each item to its own cluster, so that if you have N items, you now have N clusters, each containing just one item. Let the distances (similarities) between the clusters equal the distances (similarities) between the items they contain. 2.Find the closest (most similar) pair of clusters and merge them into a single cluster, so that now you have one less cluster. 3.Compute distances (similarities) between the new cluster and each of the old clusters. 4.Repeat steps 2 and 3 until all items are clustered into a single cluster of size N.
Computing Distances • single-link clustering (also called the connectedness or minimum method) : we consider the distance between one cluster and another cluster to be equal to the shortest distance from any member of one cluster to any member of the other cluster. If the data consist ofsimilarities, we consider the similarity between one cluster and another cluster to be equal to the greatest similarity from any member of one cluster to any member of the other cluster. • complete-link clustering (also called the diameter or maximum method): we consider the distance between one cluster and another cluster to be equal to the longest distance from any member of one cluster to any member of the other cluster. • average-link clustering : we consider the distance between one cluster and another cluster to be equal to the average distance from any member of one cluster to any member of the other cluster.
Distance based clustering are HARD methods : a data item is assigned to a cluster with probability {0, 1} Density-based clustering : each data item is assigned to ALL clusters with a different probability or “degree” of memebership No “harsh” boundaries between clusters Computational Algorithms : Expectation Maximization (EM) Density Based Clustering
Bayesian Mixture Model Clustering • Make assumptions about how attributes are distributed within each class (class model pdf). • Make assumptions about prior likelihood of number of classes. • Search for number of classes which results in best model fit to data (use EM): • Most likely number of classes J given the data • Most likely model parameters for each class. • EXAMPLE: AutoClass system developed at NASA AMES (P. Cheeseman et al, 1987). • Discovered new class of galaxies in infra-red satellite data in which astronomers could not see the classes