Download
1 / 1

E N D
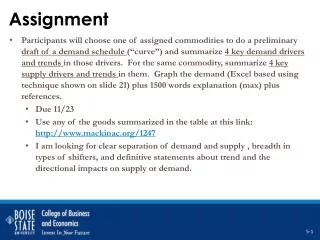
Assignment • Using Excel graphically contrast historic market prices and quantities of 4 assigned commodities and discuss reasons for the trends, cycles, and fluctuations. Summarize how market structure is apt to influence behavior and rivalry and show concrete examples. Support your graph with a reflection paper (no more than 2 pages). • Due 12/3 • Instead of 4 assigned, use any 2 good(s) you wish; ideally one is the same as that used in assignment for session #5. • Find monthly data for at least 7 years. • 2 graphs – one of prices, one of quantities. Each should have 2 lines on them (one for each of 2 goods) • I am looking for “likely” reasons for trends, cycles, and “shocks”; not a statistical analysis. • I am looking for examples of behavior and rivalry that might drive the observed prices and quantities. 5-1