Download
1 / 48
480 likes | 654 Views
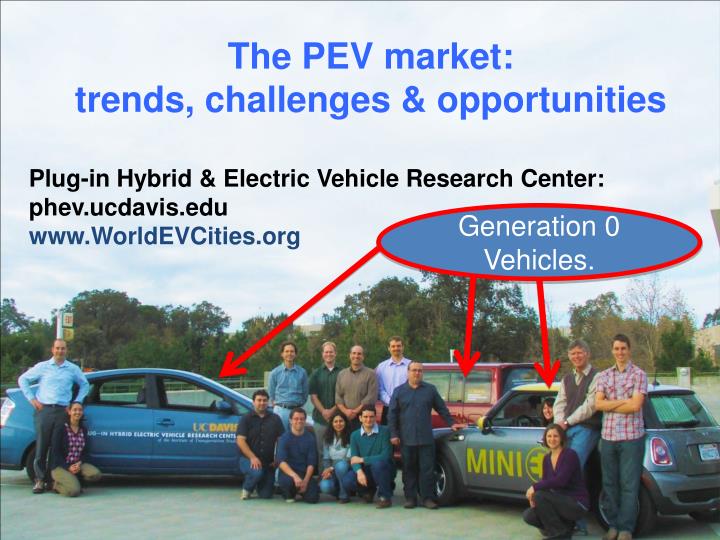
The PEV market: trends, challenges & opportunities Plug-in Hybrid & Electric Vehicle Research Center: phev.ucdavis.edu www.WorldEVCities.org. Generation 0 Vehicles. HEV market developed in 3 phases:. Japan: 3 rd generation HEV sales reached 19% in 2012,

E N D
The PEV market: trends, challenges & opportunities Plug-in Hybrid & Electric Vehicle Research Center: phev.ucdavis.edu www.WorldEVCities.org Generation 0 Vehicles.
HEV market developed in 3 phases: Japan: 3rd generation HEV sales reached 19% in 2012, Prius is best selling vehicle 4 years in row California:3rd generation HEV sales reached 7-8% 2012, Prius best selling vehicle in CA in 2012 (60,000) USA: 3rd generation HEV sales 3-4%, 2012 = 434,645 Generation 3 HEVs Early core market: 6-15% of market Generation 2 HEVs Generation 1 HEVs Fast followers: 3-5% of market Early market:1-2% 2014 2010 1996 (Japan) 2004
USA: How are we doing so far with PEVs? US HEVs (2 yrs from launch )
PEV market: glass half empty or half full? • Stated annual USA PEV sales goals of car makers • Volt goals 45,000 - actual 2012 sales 23,500 • Leaf goals 20,000 - actual 2012 sales 9,819 • Climate & energy independence goals • California - 1.5 million ZEVs by 2025 (5% of CA fleet) • USA: Obama - 1 million PEVs by 2015 (.3 % of USA fleet) • Germany, France – 1 million EVs by 2020
Size of potential PEV market in California • 1991-95, 4 year, 4 step UCD study: • A detailed project based on values, resources, vehicle purchase habits & travel needs of 600 CA households • Main assumptions: • Hybrid household hypothesis: 2 vehicles: 1 BEV & 1 • 80-120 miles of BEV range, PHEV 20 & 40 • PEVs in midsize to compact sedans, priced close to ICE, • Competition from gasoline, CNG, diesel • no FCVs, no HEVs • Gasoline was $1.50, middle of SUV market growth • BEVs: 15% of California annual sales • PHEVs: not as well understood, potentially larger depending on prices… • CNGs: less than 5%
Household Resources: A Small Percentage of Californians are Responsible for Most New Car Purchases Based on the CA sample of the NHTS 2009 (about 33% of the new vehicles sold.) (about 67% of the new vehicles sold.) (In the last five years)
Regulation: California Air Resources Board ZEV Program Governor’s Executive Order 2013 Other states “adopting” CA rules: Oregon, Washington, Delaware, Maryland, Massachusetts, New Jersey, New York, Connecticut, Maine, New Hampshire, Rhode Island
Market trends in California for PEVs • USA: • 250 million LDV vehicles • About 15 million vehicles sold per year • California: • 23 million light duty vehicles total, • About 1.5 million vehicles sold per year (10% of USA) • California PEV trends: • More than 25,000 PEVs bought since 2010 • 45% of PEVs are BEVs vs. 34% in the US market. • PEV Sales last quarter of 2012: • 2.5% of cars (1 in 40) (not including 138,000 trucks) 6,000 out of 232,512 cars sold in California
Social context: PEVs sales in California are mostly in coastal communities 2010-2012 • Regionalization of sales • California coastal cities, Portland, Seattle, Washington, • California Incentives: • $2500 for ZEV & Advanced Technology (Volt), • Allowed to drive in high occupant vehicle lanes (HOV)
BEVs are in the core areas & PHEVs are in the suburbs (so far) BEV to PHEV ratio
2007 UCD survey: 53% of US new car buyers have a 110 plug within 25 ft. of where they park at night Data from Axsen and Kurani, 2008
Those with detached houses & garages were more likely to have home recharge potential Data from Axsen and Kurani, 2008
California PEV Household Characteristics 2012 • 95% of the vehicles are owned by private individuals, 4% by businesses & 1% by government & NGOs • 83% have yearly income higher than $100K • 46% incomes is higher than $150K • 16% decline to state. • 96% live in single family dwelling • 96% own their house • 1% rent in San Diego study • 5% rent in other areas • 42% have solar panels • 18% consider installation • 40% have no plan to install • Mostly men, middle age, but shifting
Hybrids May Serve as a Gateway to Plug-ins but they are not replaced by the Leaf
Sales are often clustered, with surprising density in some neighborhoods
BMW chose us to work with them on their MINI-E experiment in 2009-10, so we got to do some BEV anthropology • 1-year lease at $850/mo. + tax • In-home charging stations (no public charging) • Out of 550 MINI Es worldwide, 450 in US PHEV center surveyed over 150 MINI E drivers & interviewed 39 households during the year
MINI E owners learn a lot about electricity, more than they knew about gasoline • How far can I drive on a kWh? • Understanding of costs, efficiency • Regenerative braking new • Driving style and feeling for energy use
Most liked the MINI E & while it was impractical for some trips, drivers engaged in developing their own EV Territory • EV driving zone • Quiet driving experience • Charging locations • BEV community • Geography of BEVs (distances, uphills, downhills, routes) • Technology for this zone (GIS systems)
MINI E drivers were most enthusiastic about the intersection of clean & fun • Strong value intersection for buyers • MINI E was quiet, smooth, easy to drive, fast • Electric vehicle has special place in public values
PEVs (BEVs & PHEVs) market development 1st generation PEVs: partial conversions, loss leaders, ¼ scale production (less than 100,000 annual) 1st buyers (pioneers): High income, future focus, educated, willing to take risks. Very regionalized: coastal Calif, Japan, Oslo, Portland Oregon: tech industries, regulations, high incentives Charging system: home based, minimal public charging in non-optimal locations, Generation 3 PEVs Generation 2 PEVs Generation 1 PEVs Early core market: 6-15% of market 1-2% of market Fast followers: 3-5% of market 2022 2010 2014 2018
2nd generation PEVs market development Generation 2 PEVs: purchases simplified, mass production, improved performance, dedicated platforms, Fast followers: high income, still “future” focused, tech followers but social leaders in networks of first buyers Market: intensifies in same regions Charging system: simpler & optimized Generation 3 PEVs Generation 2 PEVs 3-5% of market Early core market: 6-15% of market Generation 1 PEVs Early buyers 1-2% 2010 2022 2014 2018
Charging surveys: What constraints do they face and what do they want?Charging models: What do we think they want & need?(Home, workplace, public, DC fast network design tools)Data acquisition: What, where & when do they charge?(need to monitor charge use- disaggregated through vehicle systems) (also issues of etiquette, social practice) Charge network design & rollout? Location, type, density, redundancy Drs. Michael Nicholas, Gil Tal Justin Woodjack
Point of Diminishing Returns Reached at 200 DC Fast Charge Locations -model created with 1 day record for 30,000 California drivers
Survey Results (What do people want?)More than 1000 Leaf household responses • Charging is needed (regional systems) • 80% of drivers went to “1 bar” 8% • 40% of drivers exceeded “home-based” range • 7% would need charging to return from work • Charging is used • 30% charge out of home regularly • Level 1 is used more than level 2 at work (53%) • Level 2 is used more than level 1 elsewhere (78%) • Charging is wanted • 65% of Leaf owners suggested charger locations, mostly DC QC • Median distance home-QC was 44 miles (71 km)
What Return do we Get for Infrastructure Investment? (VMT/GHG) • Home Charging VMT • 60 Mile Veh. = 59% • 80 Mile Veh. = 71% • 100 Mile Veh. = 79%
What Return do we Get for Infrastructure Investment? (VMT/GHG) • Home Charging VMT • 60 Mile Veh. = 59% • 80 Mile Veh. = 71% • 100 Mile Veh. = 79%
What Return do we Get for Infrastructure Investment? (VMT/GHG) • Home Charging VMT • 60 Mile Veh. = 59% • 80 Mile Veh. = 71% • 100 Mile Veh. = 79%
What Return do we Get for Infrastructure Investment? (VMT/GHG) • L1 Work Charging is sufficient for ~5% • L2 Work Charging is needed for ~2% • Home Charging VMT • 60 Mile Veh. = 59% • 80 Mile Veh. = 71% • 100 Mile Veh. = 79%
What Return do we Get for Infrastructure Investment? (VMT/GHG) • L1 Work Charging is sufficient for ~5% • L2 Work Charging is needed for ~2% • Home Charging VMT • 60 Mile Veh. = 59% • 80 Mile Veh. = 71% • 100 Mile Veh. = 79%
What Return do we Get for Infrastructure Investment? (VMT/GHG) • L1 Work Charging is sufficient for ~5% • L2 Work Charging is needed for ~2% • Home Charging VMT • 60 Mile Veh. = 59% • 80 Mile Veh. = 71% • 100 Mile Veh. = 79%
What Return do we Get for Infrastructure Investment? (VMT/GHG) • L1 Work Charging is sufficient for ~5% • L2 Work Charging is needed for ~2% • QC accommodates up to 10% additional • Home Charging VMT • 60 Mile Veh. = 59% • 80 Mile Veh. = 71% • 100 Mile Veh. = 79%
What Return do we Get for Infrastructure Investment? (VMT/GHG) • L1 Work Charging is sufficient for ~5% • L2 Work Charging is needed for ~2% • QC accommodates up to an additional 10% EV miles • Home Charging VMT • 60 Mile Veh.= 59% • 80 Mile Veh. = 71% • 100 Mile Veh. = 79%