Download
1 / 71
720 likes | 1.35k Views
Instrumental Analysis . Fundamentals of Spectroscopy. (Absorption) Spectrophotometry n General Stuff:. •Qualitative: Spectrum (a plot of A vs. l ) is characteristic of a specific species •Quantitative: Absorbance at a particular l can be related to the amount of absorbing species

E N D
Instrumental Analysis Fundamentals of Spectroscopy
(Absorption) Spectrophotometry n General Stuff: •Qualitative: Spectrum (a plot of A vs. l) is characteristic of a specific species •Quantitative: Absorbance at a particular l can be related to the amount of absorbing species Definitions and units l .monochromatic wavelength (cm) Po.incident radiant power (erg cm -2s-1 ) P .transmitted radiant power (erg cm -2s -1) b .absorption pathlength(cm)
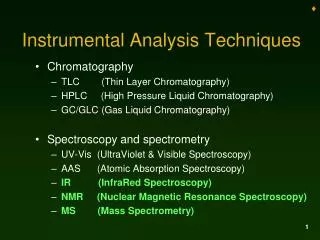
Molecular and Atomic Spectrometry • Spectrometry is the study of electromagnetic radiation (EMR) and its applications • To begin to understand the theory and instrumental application of spectrometry requires an understanding of the interaction of EMR (i.e. light) with matter
Questions • What is nature of light? • Are their different types of light? • How are they the same? • How are they different? • How does light propagate?
What is Light? • Light is a form of energy • Light travels through space at extremely high velocities • The speed of light (c) ~ 3 x 1010 cm/sec or 186,000 miles per second • Light is classified as electromagnetic radiation (EMR)
Characteristics of Light • Light behaves like a wave. • That is, it can be modeled or characterized with wave like properties. • Light also behaves like a particle. • The photon and photoelectric effect. • Today, we envision light as a self-contained packet of energy, a photon, which has both wave and particle like properties.
The EMR Spectrum Different portions of the EMR spectrum and different types of spectroscopy involve different parts (quantum states) of the atom
EMR Wave Characteristics • Wavelength (l) is the distance from one wave crest to the next. • Amplitude is the vertical distance from the midline of a wave to the peak or trough. • Frequency(v) is the number of waves that pass through a particular point in 1 second (Hz = 1 cycle/s)
EMR Wave Characteristics • The frequency of a wave is dictated (or fixed) by its source, it doesn’t change as the wave passes through different mediums. • The speed of a wave (u), however, can change as the medium through which it travels changes umedium=v = c/n Where n = refractive index nvacuum = 1 nair = 1.0003 (vair = 0.9997c) nglass ~1.5 (vgas ~ 0.67c) • Since v is fixed, asdecreases, u must also decrease
Wave Properties of Electromagnetic Radiation EMR has both electric (E) and magnetic (H) components that propagate at right angles to each other.
Particle Properties of EMR • The energy of a photon depends on its frequency (v) Ephoton = hv h= Planck’s constant h = 6.63 x 10⁻²⁷ erg sec or 6.63 x 10⁻³⁴ Js
Relationship between Wave and Particle Properties of EMR Ephoton = hv ; umedium=v = c/n • With these two relationships, if you know one of the following, you can calculate the other two • Energy of photon • Wavelength of light • Frequency of light • Ephoton = Ephoton = hv ; umedium=v = c/n • With these two relationships, if you know one of the following, you can calculate the other two • Energy of photon • Wavelength of light • Frequency of light • Ephoton =
Relationship between Wave and Particle Properties of EMR • Example: What is the energy of a 500 nm photon? • = c/l = (3 x 10⁸ m s-1)/(5.0 x 10-7 m) n = 6 x 10¹⁴ s-1 E = hn =(6.626 x 10⁻³⁴ J•s)(6 x 10¹⁴s-1) = 4 x 10-19 J
How Light Interacts with Matter. • Atoms are the basic blocks of matter. • They consist of heavy particles (called protons and neutrons) in the nucleus, surrounded by lighter particles called electrons
How Light Interacts with Matter. • An electron will interact with a photon. • An electron that absorbs a photon will gain energy. • An electron that loses energy must emit a photon. • The total energy (electron plus photon) remains constant during this process.
Characteristics of Absorption • Absorption is defined as the process by which EMR is transferred, in the form of energy, to the medium (s, l, or g) through which it is traveling • Involves discrete energy transfers • Frequency and wavelength selective • Ephoton = hv = c/
Characteristics of Absorption • Involves transitions from ground state energy levels to “excited” states • The reverse process is called emission • For absorption to occur, the energy of the photon must exactly match an energy level in the atom (or molecule) it contacts • Ephoton = Eelectronic transition • We distinguish two types of absorption • Atomic • Molecular
How Light Interacts with Matter. • Electrons bound to atoms have discrete energies(i.e. not all energies are allowed). • Thus, only photons of certain energy can interact with the electrons in a given atom.
How Light Interacts with Matter. • Consider hydrogen, the simplest atom. • Hydrogen has a specific line spectrum. • Each atom has its own specific line spectrum (atomic fingerprint).
Energy Transitions and Photons The energy of photon that can interact with a transition jump depends on the energy difference between the electronic levels.
Unique Atomic Signatures Each atom has a specific set of energy levels, and thus a unique set of photon wavelengths with which it can interact.
Energy Level Diagram • Absorption and emission for the sodium atom in the gas phase • Illustrates discrete energy transfer ΔEtransition = E1 - E0 = hv = hc/
Molecular Absorption • More complex than atomic absorption because many more potential transitions exist • Electronic energy levels • Vibrational energy levels • Rotational energy levels • Emolecule = Eelectronic + Evibrational + Erotational • Eelectronic > Evibrational > Erotational • Result - complex spectra
Molecular Absorption Spectra of Benzene in the Gas Phase Electronic Transition Vibrational Transition Superimposed on the Electronic Transition Absorption Band – A series of closely shaped peaks
Molecular Absorption Spectra in the Solution Phase • In solvents the rotational and vibrational transitions are highly restricted resulting in broad bandabsorption spectra
Beer’s Law or the Beer-Lambert Law Pierre Bouguer discovered that light transmission decreases with the thickness of a transparent sample in 1729. This law was later rediscovered by Lambert, a mathematician, and then by Beer, who published in 1852 what is now known as the Beer-Lambert-Bouguer law. Beer's 1852 paper is the one that is often cited in older textbooks. Bouguer's contribution is rarely mentioned and the law is known as either "Beer's law" or "the Beer-Lambert law".
Spectroscopy Terms Describing Absorption (Beer’s Law) • Consider a beam of light with an (initial) radiant intensity Po • The light passes through a solution of concentration (c) • The thickness of the solution is “b” cm. • The intensity of the light after passage through the solution (where absorption occurs) is P Concentration (c) P0 hv P b
We Define Transmittance (T) = P/P0 (units = %) Absorbance (A) (units = none) A = log (P0/P) A = -log (T) = log (1/T) A = abc (or εbc) <---Beer’s Law a = absorptivity (L/g cm) b = path length (cm) c = concentration (g/L) ε = molar absorptivity (L/mol cm) • Used when concentration is in molar units
Transmittance T => transmittance P T = ----- Po b Po P
Example P0 = 10,000 P = 5,000 -b- A = -log T = -log (0.5) = 0.3010
Beer’s Law A = abc =ebc A c
Beer’s Law A = ebc Path Length Dependence, b Readout Absorbance 0.82 Source Detector
Beer’s Law A = ebc Path Length Dependence, b Readout Absorbance 0.62 Source b Detector Sample
Beer’s Law A = ebc Path Length Dependence, b Readout Absorbance 0.42 Source Detector Samples
Beer’s Law A = ebc Path Length Dependence, b Readout Absorbance 0.22 Source Detector Samples
Beer’s Law A = ebc Wavelength Dependence, a Readout Absorbance 0.80 Source b Detector
Beer’s Law A = ebc Wavelength Dependence, a Readout Absorbance 0.82 Source Detector
Beer’s Law A = ebc Wavelength Dependence, a Readout Absorbance 0.30 Source b Detector
Beer’s Law A = ebc Wavelength Dependence, a Readout Absorbance 0.80 Source b Detector
Non-Absorption Losses "Reflection and scattering losses." AKA The Guinness Effect
Limitations to Beer’s Law • Real • At high concentrations charge distribution effects occur causing electrostatic interactions between absorbing species • Chemical • Analyte dissociates/associates or reacts with solvent • Instrumental • ε = f(λ); most light sources are polychromatic not monochromatic (small effect) • Stray light – comes from reflected radiation in the monochromator reaching the exit slit.
Chemical Limitations A reaction is occurring as you record Absorbance measurements Cr2O72- + H2O 2H+ + CrO42- CrO42- Cr2O72- A550 A446 300 400 500 concentration concentration wavelength
Instrumental Limitations - ε = f(λ) • How/Why does ε vary with λ? • Consider a wavelength scan for a molecular compound at two different wavelength bands • In reality, a monochromator can not isolate a single wavelength, but rather a small wavelength band Larger the Bandwidth – larger deviation
Instrumental Limitations – Stray Light • How does stray light effect Absorbance and Beer’s Law? • A = -log P/Po = log Po/P • When stray light (Ps) is present, the absorbance observed (Aapparent) is the sum of the real (Areal) and stray absorbance (Astray)
Instrumental Limitations – Stray Light • Aapp = Areal + Astray = • As the analyte concentration increases ([analyte]↑), the intensity of light exiting the absorbance cell decreases (P↓) • Eventually, P < Ps