Download
1 / 24
240 likes | 359 Views
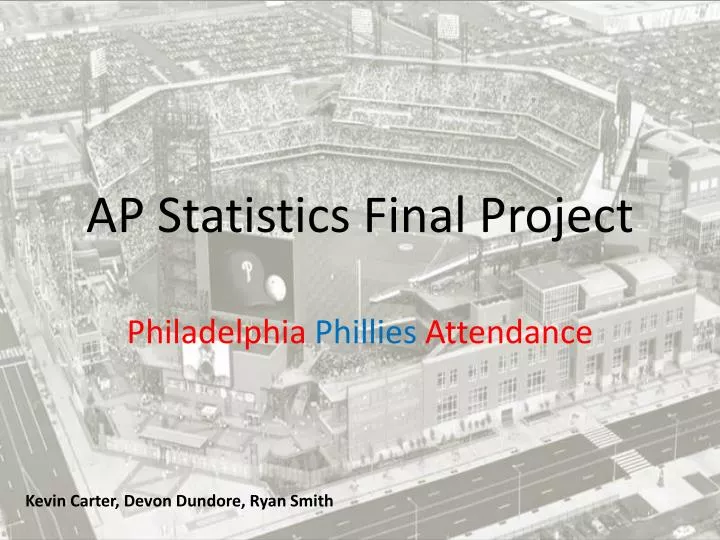
AP Statistics Final Project. Philadelphia Phillies Attendance. Kevin Carter, Devon Dundore, Ryan Smith. About the Phils. Oldest one-named, one-city franchise in all professional American sports First game played on May 1, 1883 2 World Series Victories (1980, 2008). About the Bank.

E N D
AP Statistics Final Project PhiladelphiaPhilliesAttendance Kevin Carter, Devon Dundore, Ryan Smith
About the Phils • Oldest one-named, one-city franchise in all professional American sports • First game played on May 1, 1883 • 2 World Series Victories (1980, 2008)
About the Bank • Built in 2004 • 43,651 seats • Sold out 73 times in 2009 • Biggest attendance 46,208 • 2008- Celebrated first World Series since 1980
Studying the Statistics Studied Phillies attendance from 2004-2009 depending on… - Weather (temperature) - Time of day • Calculator randomly select 10 games from each season • Look up time of first pitch and park attendance of past games using www.baseball-reference.com and www.fairview.ws
Tests and Data Analysis cont. Create scatter plots of comparisons to view LSR and correlation Conduct a 2 sample t confidence interval for each comparison of statistics Also, conduct a 1 sample t confidence interval of the average attendance at Citizens Bank Park
Analysis Correlation= .04622 Coefficient of Determination= .0021 LSR: Attendance=30.0423(Temperature)+35012 • Weak (scattered) • Very slightly positive Residual plot is scatter so LSR is a decent fit
Data Conclusion • .21% of the change in attendance is due to the change in temperature • Temperature seems to have practically no relationship or effect on Phillies game attendance
Analysis Correlation= -.118 Coefficient of determination= .014 LSR: Attendance= -419.731(Start)+44841 • Weak (slightly scattered) • Slight negative slope Residual Plot is scatter so LSR is a good fit
Data Conclusion • 1.2% of the change in attendance is due to the change in start time of the game • Start time seems to have practically no relationship or effect on Phillies game attendance
Tests and Data Analysis Use linear regression t tests for both comparisons to test the hypothesis that… Beta= 0 or Beta>0 (temperature) Beta=0 or Beta>0 (time of day)
Test 1 (temperature) • STATE • SRS • True relationship is linear CHECK -Checks out -Assume (scatter plots) *Sample size of 60 games
t= b/SEb t= .3524 (df=58) P(t> .3524|df=58)= .36 .36>.05 so… We fail to reject the null hypothesis because the p-value is greater than .05. We have sufficient evidence that the slope of the LSR line is not greater than zero. The weather does not have a great effect on Phillies game attendance.
Mean+/- t-score(Stand. Dev. of Stat.) = (35201.9, 39256.2) We are 95% sure that population difference of means lies between 35201.9 and 39256.2 people attending the game.
Test 2 (time of day) CHECK -Checks out -Assume (scatter plots) STATE • SRS - True relationship is linear *Sample size of 60 games
t= b/SEb t= -.9085 (df=58) P(t>-.9085|df=58)= .82 .82>.05 so… We fail to reject the null hypothesis because the p-value is greater than .05. We have sufficient evidence that the slope of the LSR line is not greater than zero. The start time of the game does not have a great effect on the Phillies attendance.
Mean+/- t-score(Stand. Dev. Of Stat.) = (35260, 39314.6) We are 95% sure that the population difference of means lies between 35260 and 39314.6 people attending the game.
Bias/Error • Attendance can be affected by other things (team being played, pitcher, star ball players, promotions, ticket pricing) • Phillies were better and more popular during some year than others • Data included many more night game times than afternoon games
Personal Opinions • We would have thought that our data would have a had a better correlation. • We feel that our own decisions to go to a game is somewhat effected by time and temperature. (Rainy day = colder weather) • We feel that there was to much bias to our data.
Conclusion • In conclusion, we can say that time of day and temperature has no relation to the attendance of a Philadelphia Phillies baseball game. Either nothing or something else is effecting the attendance of these games.