Download
1 / 8
80 likes | 185 Views
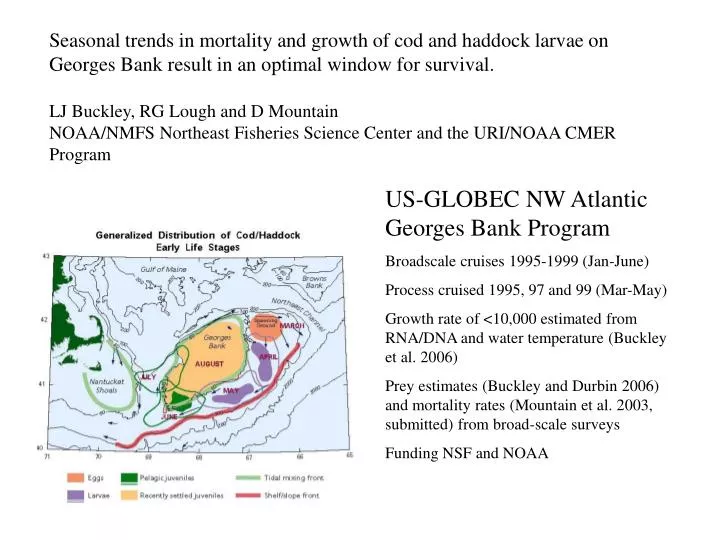
Seasonal trends in mortality and growth of cod and haddock larvae on Georges Bank result in an optimal window for survival. LJ Buckley, RG Lough and D Mountain NOAA/NMFS Northeast Fisheries Science Center and the URI/NOAA CMER Program. US-GLOBEC NW Atlantic Georges Bank Program

E N D
Seasonal trends in mortality and growth of cod and haddock larvae on Georges Bank result in an optimal window for survival. LJ Buckley, RG Lough and D Mountain NOAA/NMFS Northeast Fisheries Science Center and the URI/NOAA CMER Program US-GLOBEC NW Atlantic Georges Bank Program Broadscale cruises 1995-1999 (Jan-June) Process cruised 1995, 97 and 99 (Mar-May) Growth rate of <10,000 estimated from RNA/DNA and water temperature (Buckley et al. 2006) Prey estimates (Buckley and Durbin 2006) and mortality rates (Mountain et al. 2003, submitted) from broad-scale surveys Funding NSF and NOAA
Observed and predicted larval growth rates. Predicted values were from a GAM incorporating larval size and photoperiod. (Buckley et al. 2006)
Percentage of variability in observed growth of larval cod and haddock explained Cod Haddock Unexplained 29 % 48% 39% Date and Size 61% Year10% 13% Factors contributing to the year effect: food, salinity, and density
Cod Predicted and Observed Mortality Rate (d-1) ◊Red-High Mortality (1995-96) ◊Green-Low Mortality (1998-99) Mortality = C – m1pp + m2pp3 + m3dumv 1997 (not shown) constant M in cod (mean 0.067) and decreasing M in haddock Predicted and Observed Mortality (d-1) Haddock
Cod – Low Mortality and 1999 Growth M/G (right axis) is an index of stage-specific mortality and the rate of change in biomass. M/G M G In years with low mortality and high G, M< G for a period in March allowing the biomass of the cohort to increase. Cod – High Mortality and 1995 Growth M/G M In years with high mortality, M was always >G in young larvae. G
Trends in Biomass Cod In most years, the March and February cohorts fared better than later cohorts. In years with low M and high G, biomass of these early cohorts increased in the first 30 dph. In 1997, the May cohort may have experienced an early increase in biomass. Low Mortality-High Growth (1998-99) High mortality-Low Growth (1995-96) Constant Mortality-High Growth (1997)
Using the same G and M models with the photoperiod schedule for Norway results in a much narrower optimum window for Atlantic cod larvae. Georges Bank Norway
Conclusions Strong seasonal trends in G and M interact to determine the change in biomass of cohorts. The fastest growing cohorts, those hatched in May, are rapidly lost to predators in most years. In years with abundant prey early in the year, cohorts hatching in February and March experience lower mortality and can increase rapidly in biomass. These early cohorts may ultimately make up the bulk of the survivors. In agreement with the conclusions above, otolith microstructure analysis of haddock surviving to the fall in the Gulf of Maine (Lapolla and Buckley 2005) and the North Sea (Wright and Gibb 2005) indicate strong negative selection on hatch date. Our data support Pope et al’s (1995) “optimal fish strategy” in a seasonally-perturbed, size spectrum. Successful cod and haddock hatch ahead of the peak abundance of prey, reaching a large size before being overtaken by the wave of abundant predators.