Download
1 / 28
280 likes | 412 Views
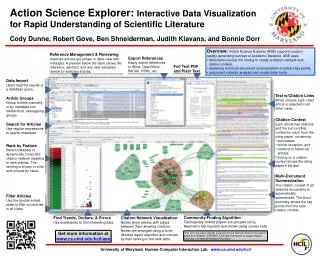
Network Visualization by Semantic Substrates Ben Shneiderman and Aleks Aris. Presented by: Morimichi Nishigaki, Galileo Namata (Slides borrowed from Ben Shneiderman and Aleks Aris). Review Network Vis. Strategies. Node-link Diagrams. Other Diagrams. Force-directed. Familiar Layout.

E N D
Network Visualization by Semantic SubstratesBen Shneiderman and Aleks Aris Presented by: Morimichi Nishigaki, Galileo Namata (Slides borrowed from Ben Shneiderman and Aleks Aris)
Review Network Vis. Strategies Node-link Diagrams Other Diagrams Force-directed Familiar Layout Matrix-based Circular layout Temporal Placement Clustering
Force-directed >30% Circular Layout ~15% Familiar Layout ~30% Statistics on Strategies Node layout strategy First 100 in visualcomplexity.com
Collection of Challenges • What are the challenges? • C1) Basic networks: nodes and links • C2) Node labels • C3) Link labels • C4) Directed networks • C5) Node attributes • C6) Link attributes Recurring Theme: More nodes and links = Harder!!!
C1) Basic Networks – Nodes and Links Power Law Graph, Linyuan Lu Power Law Graph 5000 nodes Uniformly distributed Source: www.visualcomplexity.com (135) Vizster, Heer et al. Social friendship network 3 degrees from Heer 47,471 people 432,430 relations Source: www.visualcomplexity.com (97)
C2) Node Labels Internet Industry Partnerships, Valdis Krebs • Adding labels • e.g. article title, book author, animal name • Nodes overlap with other nodes • Nodes overlap with links Source: www.visualcomplexity.com (168) 250 nodes
C3) Link Labels Netscan, Marc Smith Adding Labels e.g. Strength of connection, type of link Challenges: Length Space Belongingness Distinction from other labels & other types of labels Source: www.visualcomplexity.com (127)
C4) Directed Networks • Direction • arrows • labels • thickness • color Yeast Protein Interaction SeeNet, Becker et al. Source: [1] Becker et al. Source: www.visualcomplexity.com (127)
C5 & C6 Node & Link Attributes CIA World Factbook Visualization, Moritz Stefaner • Types: • Categorical (e.g. mammal/reptile/bird/fish/insect) • Ordinal (e.g. small/medium/large) • Numerical (e.g. age/weight) • Values of node attributes indicated by node size and shape • Values of link attributes indicated by a letter and color Source: www.visualcomplexity.com (192)
Statistics on Challenges Challenges First 100 in visualcomplexity.com C6 ~2% C5 ~10% C1 ~12% C4 ~10% • C1) Basic networks • C2) Node labels • C3) Link labels • C4) Directed networks • C5) Node attributes • C6) Link attributes C2 ~66%
High Priority Tasks C5-6) Attributes Variations on T1-10: count # of nodes in each category T11) find links b/w nodes with deferent attribute values T12) find the proportion links from a node that go to each category for every node T13) for a pair of nodes, find paths with the lowest cost T14) find links with connection strength greater than 0.5 C4) Directed links Variations on T1-10: shortest paths, etc. C2-3) Label T9) for every node/link, read the label T10) find all nodes/links with a given label C1) Basic Network T1) count number of nodes and links T2) for every node, count degree T3) for every node, find the nodes that are distance 1, 2,… T4) for every node, find betweenness centrality T5) for every node, find structural prestige T6) find diameter of the network
Two Principles • Layout based on user-defined semantic substrates: non-overlapping regions • Group nodes into regions • According to an attribute • Categorical, ordinal, or binned numerical • In each region: • Place nodes according to other attribute(s) • Adjustable sliders to control link visibility:limit clutter • Give users control of link visibility
Legal Precedent Example • Department of Government and Politics, Univ. of Maryland • http://www.bsos.umd.edu/gypt/CITE-IT/ • Contains 2780 federal judicial cases from 1978-2005 on “regulatory takings” • Regulatory taking - a government regulates a property that the regulation effectively amounts to an exercise of the government's eminent domain power without divesting the property's owner of title to the property.
After Semantic Substrates • NVSS 1.0 Demo • And now to our featured presentation … • Please pardon our resolution. This is as big as our screen gets.
Circuit Court Citations 9th Circuit Court Federal Circuit Court
UMD COM Female Male Jr Med Sr Low Med High ORG EDU Other Examples: Email To & CC list co-recipients
Mammals Reptiles Insects Fish Birds Other Examples: Foodwebs
Discussion • Advantages • Location conveys meaning, interpretable • Instant perception of • different types of nodes • their relative number • connections between different groups of nodes • Limitations • Beyond 5 regions becomes challenging • Constraint on nodes interferes with aesthetics
Now where can I get this amazing tool? www.cs.umd.edu/hcilwww.cs.umd.edu/hcil/nvss www.cs.umd.edu/~aris/nvss LabProjectDemo
Other “Semantic Substrates” Jambalaya PivotGraph D-Dupe Pretorius et al.