Download
1 / 19
190 likes | 305 Views
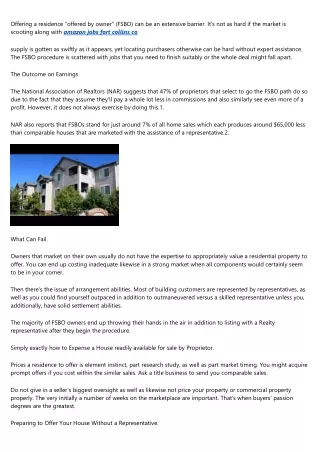
Impact of the High Park Fire on Water Quality in the Fort Collins Area. Cristina Tillberry Summer REU 2013 8/8/13. A study in conjunction with Dr. Fernando Rosario-Ortiz, Kaelin Cawley , and Amanda Hohner. High Park Fire. 87, 284 acres 1 fatality 259 homes destroyed

E N D
Impact of the High Park Fire on Water Quality in the Fort Collins Area Cristina Tillberry Summer REU 2013 8/8/13 A study in conjunction with Dr. Fernando Rosario-Ortiz, KaelinCawley, and Amanda Hohner
High Park Fire 87, 284 acres 1 fatality 259 homes destroyed Burned June 9 to July 1, 2012 Figure: Study area showing burned area and location of proposed sampling locations on the Poudre River
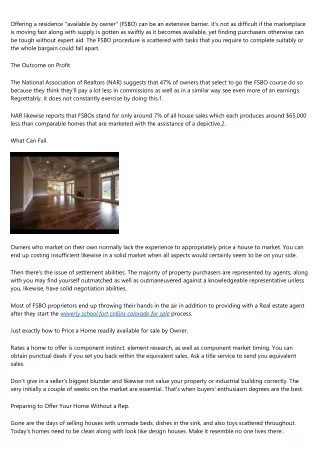
Cache La Poudre Watershed • Poudre River is the main source of drinking water for three major water districts, including Fort Collins, CO • Drinking water intake facility is within burn area • Sampling river water at three different test sites • Control site upstream of burn area • Burn area downstream • Water intake facility in burn area Figure: Filters from control site water sample (left) and burn area site water sample (right)
Motivation • Determine how wild fires affect water quality and drinking water treatment • Characterize dissolved organic matter (DOM) in water • DOM may hinder the treatment facility to efficiently treat the water • Analyze similarities and differences in data between before coagulation and after coagulation samples
What did we do? • Surface water samples were collected from three sites on the Poudre River and filtered • Reference site • Impacted – upstream • Impacted – downstream (water intake facility) • Used different techniques to gather data from samples • Size Exclusion Chromatography • UV-Visible Spectroscopy • Fluorescence Spectroscopy / Excitation and Emission Matrices • Coagulated samples to compare data from before and after
SEC: Size Exclusion Chromatography • Physically separates compounds based on size • Measures hydrodynamic volume, not actual molecular weight • Uses porous particles to separate different sized molecules in the sample • Particles that are smaller than the pores in the column will enter the pores • longer path and longer transit time Figure: Diagram describing process of size exclusion chromatography
UV-Visible Spectroscopy • Measures the absorbance from a sample • Light is shined onto the cuvette • light absorbance for the sample is compared to the light absorbance of the water blank • UV-Vis data used to correct EEMs data Figure: UV-Vis spectroscopy diagram
Fluorescence Spectroscopy • A technique that measures the emission of radiation by a material that has been excited • Once the output is determined, a fluorescence spectrum can be created • From spectrum, fluorescence index (FI) can be used to determine type of DOM in the water • Higher FI: more microbial input • Lower FI: more terrestrial input • Also referred to as excitation and emission matrices (EEMs) Figure: Fluorescence spectroscopy diagram
Coagulation Coagulant added to water to settle impurities Clear water at top is removed and filtered Figure: Coagulant added to water to remove impurities
Results - SEC Ran SEC samples before and after coagulation DOM: dissolved organic matter JT: jar test Figure: SEC data for control site and water intake facility in burn area before (DOM) and after (JT) coagulation
Results - SEC PBR: control site PNF: water intake facility in burn area Date: 130401 (April 1, 2013) Mw: Weight average molecular weight A: absorbance M: molecular weight Table: MW data for control site and water intake facility in burn area before (DOM) and after (JT) coagulation
Results - Molecular Weight Snow melt Snow melt Figure: MW data for control site and water intake facility in burn area before (DOM) and after (JT) coagulation
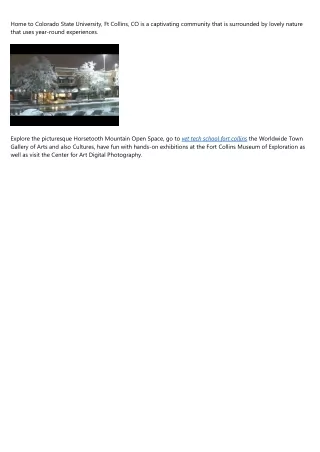
Results - Fluorescence Excitation and Emission Matrix (EEMs) data Color: intensity Contour lines: peaks Figure: EEMs data for control site before (DOM) and after (JT) coagulation
Results - Fluorescence Higher FI: more microbial input Lower FI: more terrestrial input Table: Fluorescence Index for before (DOM) and after (JT) coagulation samples
Conclusions • Molecular weight • Increased after snow melt for control site • Decreased after snow melt for impacted water intake facility • Intensity of radiation emission wavelengths decreased after coagulation • According to EEMs contour plots • More terrestrial input before coagulation • Coagulants removed most of terrestrial matter • Microbial input is more evident when terrestrial input is removed
What’s next? • Collecting storm samples • Determine differences between storm run off and snow melt • Determine differences between summer and winter samples • Determine if more or less terrestrial input in water • More shrubs growing back in burn area • Stop terrestrial input
Sampling is fun! Gathering water samples from the Poudre River
References [1] Rosario-Ortiz, F. & Summers, R.S. (2013). The impact of the high park fire on the source water quality for utilities in fort collins area: Cache la poudre river watershed. (University of Colorado). [2] Coble, P. G. (1996). Fluorescence contouring analysis of doc intercalibration experiment samples: a comparison of techniques. (University of Washington). [3] International Humic Substances Society. (2007, December). What are humic substances?. Retrieved from http://www.humicsubstances.org/whatarehs.html [4] Iowa State University of Science and Technology. (2008). High performance liquid chromatography (hplc) . Retrieved from http://www.protein.iastate.edu/hplc.html [5] Tissue, B. M. (2000). Size exclusion chromatography (sec). Retrieved from http://www.files.chem.vt.edu/chem-ed/sep/lc/size-exc.html [6] Gullapalli, S. (2010, June 26). Optical characterization of group 12-16 (ii-vi) semiconductor nanoparticles by fluorescence spectroscopy. Retrieved from http://cnx.org/content/m34656/1.1/ [7] Williams, M., McKnight, D., Simone, B., Cory, R., Miller, M., Gabor, R., Hood, E. (2011). PARAFAC workshop spring 2011. (University of Colorado). [8] Maie, N., Watanabe, A., Kimura, M. (2004). Chemical characteristics and potential source of fulvic acids leached from the plow layer of paddy soil. (Nagoya University). [9] Reusch, W. (2013). UV-Visible Spectroscopy. Retrieved from http://www2.chemistry.msu.edu/faculty/reusch/VirtTxtJml/Spectrpy/UV-Vis/uvspec.htm#uv1 [10] Kauffman, J.M. (2005).Water fluoridation: A review of recent research and actions. Journal of American Physicians and Surgeons, 10(2): 38-44. Retrieved from http://www.usaus-h2o.org/modules/treatment-and-distribution/