Download
1 / 23
240 likes | 587 Views
Chapter 15: Acid / Base Chemistry. 15.3 pH Changes in Acid-Base Reaction Systems. pH curves. A pH curve is a graph showing the continuous change in pH during a titration (an acid-base reaction) Inv. 15.3 Demonstration – pH curves Titration of NaOH and Na 2 CO 3 with HCl

E N D
Chapter 15:Acid / Base Chemistry 15.3 pH Changes in Acid-Base Reaction Systems
pH curves • A pH curve is a graph showing the continuous change in pH during a titration (an acid-base reaction) • Inv. 15.3 Demonstration – pH curves • Titration of NaOH and Na2CO3 with HCl 14 pH 7 0 vol. of titrant (HCl) added (mL)
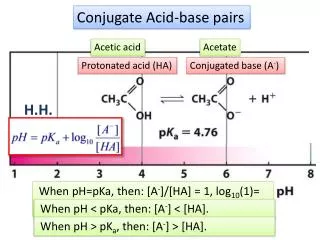
Titration Terminology (Gr.11) • Titration – the progressive transfer of a solution from a buret (called the titrant) into a measured volume of another solution (called the sample). • Equivalence point – the volume of titrant required to neutralize the sample (# mol acid = # mol base). • Endpoint – the pH at the equivalence point of a titration. • Indicator – a chemical which is added to the sample that changes colour at the equivalence point of a titration. • Buffering region – a horizontal region of the pH curve where pH is not changing significantly.
Interpreting pH curves • Titration of NaOH with HCl 14 buffer region titrant pH endpoint equivalence point 7 X equivalence point volume buffer region 0 0 10 20 30 40 volume of titrant added (mL)
Which is the titrant? • Take 2 titrations involving NaOH and HCl pHpH vol. of titrant vol. of titrant • HCl is titrant NaOH is titrant • (pH high to low) (pH low to high)
Choosing an Indicator • pH curves are used to determine which indicator(s) are suitable for a particular titration • The goal is to get an indicator that changes colour in the same region as the endpoint of your titration • Titration of NaOH with HCl 14 unsuitable: alizarin yellow (too early) pH good indicators: bromothymol blue, 7 litmus and phenol red unsuitable: orange IV (too late) 0 vol. of titrant (HCl) added (mL)
Multiple Endpoints • Titration of Na2CO3 with HCl 14 endpoint 1 8 X pH endpoint 2 equivalence point volume 1 4 X equivalence point volume 2 0 0 10 20 30 40 volume of titrant added (mL)
Choosing Indicators for Multiple Endpoints • Titration of Na2CO3 with HCl 14 endpoint 1 - metacresol purple (7.4-9.0) 8 X pH endpoint 2 – methyl orange (3.2-4.4) 4 X 0 0 10 20 30 40 volume of titrant added (mL)
Interpreting Endpoints • The Bronsted-Lowry 5-step method can be used to write proton-transfer reactions that explain the endpoints on a pH curve • In general, we only observe distinct endpoints on a pH curve when a proton has been quantitatively transferred from an acid to a base; incomplete reactions are not observed • The number of endpoints that are observed represent the number of proton transfer reactions between B-L acids and B-L bases in a titration
Using the B-L 5-Step Method to Explain Endpoints • Titration of NaOH with HCl 14 pH 7 X we can write a proton transfer reaction to explain this endpoint 0 0 10 20 30 40 volume of titrant added (mL)
Writing B-L Equations to Explain Endpoints • To explain the endpoint observed for the titration of NaOH with HCl, we use the B-L 5-step method: • SA A • Na + OH - H3O + Cl - H2O • SB B B • H + • Endpoint: H3O + + OH - 2 H2O
Using the B-L 5-Step Method to Explain Endpoints • Titration of NaOH with HCl 14 pH 7 X H3O + + OH - 2 H2O 0 0 10 20 30 40 volume of titrant added (mL)
Polyprotic Acids and Bases • Polyprotic acids are those which can donate more than one proton; in most cases, it is equal to the number of hydrogens in the chemical formula • E.g. H2SO4 : can donate 2 protons • E.g. H3PO4 : can donate 3 protons • Polyprotic bases are those which can accept more than one proton; in most cases it is equal to the magnitude of the charge on the anion • E.g. CO3 2- : can accept 2 protons • E.g. PO4 3- : can accept 3 protons
Using the B-L 5-Step Method to Explain Polyprotic Endpoints • Titration of Na2CO3 with HCl 14 8 X endpoint 1 pH 4 X endpoint 2 0 0 10 20 30 40 volume of titrant added (mL)
Writing B-L Equations to Explain Polyprotic Endpoints • To explain the first endpoint observed for the titration of Na2CO3 with HCl, we will use the B-L 5-step method: • SA A • Na + CO32- H3O + Cl - H2O • SB B B H + • Endpoint 1: H3O + + CO32- H2O+ HCO3 -
Writing B-L Equations to Explain Polyprotic Endpoints • To explain the second endpoint, we must consider not just the original entities, but those entities that were consumedin the first reaction and entities that were createdin the first reaction • SA A A • Na +CO32- H3O + Cl - H2O HCO3- • B BSB H + • Endpoint 2: H3O + + HCO3- H2O+ H2CO3
Using the B-L 5-Step Method to Explain Polyprotic Endpoints • Titration of Na2CO3 with HCl 14 8 X H3O+ + CO32- H2O+ HCO3 - • pH 4 X H3O+ + HCO3- H2O + H2CO3 0 0 10 20 30 40 volume of titrant added (mL)
Other Polyprotic Systems • Consider the titration of phosphoric acid, H3PO4, with sodium hydroxide, NaOH: 11 X endpoint 2 pH X endpoint 1 0 Vol. of NaOH (mL)
Other Polyprotic Systems • To explain the first endpoint observed for the titration of H3PO4 with NaOH, we use the B-L 5-step method: • SA A • H3PO4 Na + OH - H2O • SB B H + • Endpoint 1: H3PO4 + OH - H2O+ H2PO4-
Other Polyprotic Systems • To explain the second endpoint, we must consider not just the original entities, but those entities that were consumedin the first reaction and entities that were createdin the first reaction • A SA • H3PO4Na + OH - H2O H2PO4- • SB BB H + • Endpoint 2: H2PO4- + OH - H2O+ HPO4 2-
Other Polyprotic Systems • The B-L method suggests there is the possibility of a third endpoint: • A SA • H3PO4Na + OH - H2O H2PO4-HPO42- • SB BBB • However, because it was not observed in the pH curve, it must mean the reaction was not quantitative, therefore we must write it with a double arrow H + > 50% • Endpoint 3: HPO42- + OH - H2O+ PO4 3- • (not observed)
Other Polyprotic Systems • Consider the titration of phosphoric acid, H3PO4, with sodium hydroxide, NaOH: 11HPO42- + OH - H2O+ PO43- (not observed) H2PO4- + OH- H2O+ HPO42- X pH X H3PO4 + OH - H2O+ H2PO4- 0 Vol. of NaOH (mL)
Homework: • Answer Q. 24-29 p.539-540.