Download
1 / 30
300 likes | 584 Views
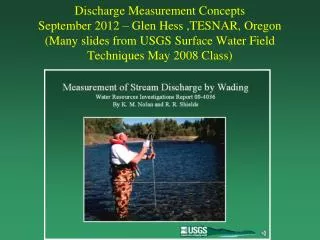
USGS Procedures for High-Flow Measurement using the Price AA Meter. Annual Tri-Agency Coordination Meeting Memphis, TN. Mark E. Smith mesmith@usgs.gov USGS CRSO, Denver, CO November 17, 2009. Discharge and Velocity Measurement.

E N D
USGS Procedures for High-Flow Measurement using the Price AA Meter Annual Tri-Agency Coordination Meeting Memphis, TN Mark E. Smith mesmith@usgs.gov USGS CRSO, Denver, CO November 17, 2009
Discharge and Velocity Measurement • A current-meter measurement is the summation of the products of the subsection areas of the stream cross section and their respective average velocities • USGS uses the mid-section computational method
Stream discharge is sum of discharges in all sub-sections (mid-section method) Total Discharge = ((Area1 x Velocity 1) + (Area2 x Velocity2) + ….. (Arean x Velocityn))
Velocity Measurement • Flow velocity in natural channels generally pulsates. The USGS measures velocity for 40 - 70 seconds to better represent average velocity at a point. Comparison of pulsations for two different mean velocities measured in a laboratory flume, 12 ft wide. (Rantz, 1982; vol. 1)
Vertical-Velocity Curve • The vertical-velocity profile under normal conditions tends to have the shape shown below. We can use this relation to compute a mean vertical velocity based on measurements at certainpoints in the vertical.
Six-Tenths Velocity Method • In the 0.6-depth method, an observation of velocity made in the vertical at 0.6 of the depth below the surface is used as the mean velocity in the vertical • The U.S. Geological Survey uses the 0.6-depth method under relatively shallow conditions
Two-Point Velocity Method • When velocity profiles are relatively normal, the average velocity can be adequately estimated by averaging velocities at .2 and .8 of the depth below the water surface • The two-point method is used with the Price AA meter when depths are > 2.50 ft
Three-Point Velocity Method • In the three-point method velocities are observed at 0.2, 0.6, and 0.8 depths. • Usually, the mean velocity is computed by averaging the 0.2- and 0.8-depth observations and then averaging that result with the 0.6-depth observation. • The three-point method is used when velocities in the vertical likely are distributed abnormally because of disturbing elements in the water. • Note: With a Price AA current meter, the three-point method cannot be applied unless the depths are greater than 2.5 ft (0.76 m).
Vertical-Velocity Curve 0.2 0.6 0.8
Current-Meter Measurementof High Flows(Bridges, Boats, or Cableways)
Current-Meter Measurementof High Flows • The Price AA current meter generally is used when making a conventional high-flow measurement. Depth is measured using asounding reel;velocity ismeasured afterpositioning themeter in thevertical.
Current-Meter Measurementof High Flows • Some reels are equipped with a computing depth indicator. To use the computing spiral, the indicator is set at zero when the center of the current-meter rotor is at the water surface. The sounding weight and meter are then lowered until the weight touches the streambed.
Preparation for Measurement • Spacing of verticals is determined to provide about 25 to 30 subsections • Verticals should be so spaced that no subsection has more than 10 percent (ideally 5 percent) of the total discharge (approximated using the most current shift-adjusted rating)
Current-Meter Measurementof High Flows • The depth at each observation vertical (recorded to nearest 0.1 foot) determines the method of velocity measurement to be used, normally the two-point or the 0.6-depth method. If a non-standard velocity distribution is suspected, we use the three-point method. • After the meter is placed at the proper depth and pointed into the current, the number of revolutions made by the rotor is counted for a period of 40 to 70 s. The stopwatch is started simultaneously with the first signal or click, which is counted as "zero," and not "one."
Current-Meter Measurementof High Flows • The size of the sounding weight used in current-meter measurements depends on depth and velocity in the cross section. • The size of the weight (lbs) should be greater than the maximum product of velocity (ft/s) and depth (ft) in the cross section (more if there is debris or ice). If insufficient weight is used, the meter assembly will be dragged downstream, resulting in errors in the depth computation.
Velocity Adjustment forDirection of Flow • Required velocity is the component normal to measurement section • At vertical locations where the meter points into an oblique current, multiply measured velocity in the vertical by thecosine of angle,a.
Measurement of Swift,Deep Streams • At sites where depth soundings are possible (i.e. weight will reach the bottom) but weight, meter drift downstream: • Depth measured by usual methods will be in error – too large • Error correction has 2 parts • Air (dry-line) correction • Wet-line correction
Measuring Depth a Vertical angle of sounding line Dry-line correction (cd) corrects for excess amount of line above water p c d b p
Measuring Depth - cont. • Wet-line correction corrects for excess amount of line below the water • Not a linear function with depth • Correction applied to nearest 0.1 foot • Cannot be determined until the dry-line correction has been deducted from observed depth p
Measuring Depth - cont. Best to eliminate dry-line correction by Using tags on the sounding line (bridges); or Using a stay-line to facilitate depth measurement from the water surface (boat deck)
Measuring Depth - cont. Both dry-line and wet-line corrections can be computed using an Excel spreadsheet
USGS Measurement using Price AA:Mississippi River at Natchez, MS May 27, 2009
Boat-Measurement Procedure 300-lb weight used to suspend current meter 300-ft stay line (attached to bridge) used to hold horizontal line and position at each vertical Suspension of current meter initiated from boat deck, so no air-line correction needed Vertical angle of sounding line measured from boat boom to determine and apply wet-line correction
Boat-Measurement Procedure – cont Depths at each of 27 verticals measured using onboard depth finder (and compared to ADCP readings). Depths ranged from 24.0 to 118.0 ft Velocities measured at .2, .6, and.8 depth points for40 seconds in each vertical. Average velocities in the 27 verticals ranged from 3.0 to 10.0 ft/s(no direction-of-flow adjustments were needed) Standard mid-section method used to compute discharge
Discharge-Computation Results • Cross-section Area = 192,000 ft2 (by depth finder) • Discharge by .2, .6, .8 method Q1=1,460,000 cfs; Avg. V=7.60 ft/s • Discharge by .2, .8 methodQ2=1,410,000 cfs (-3.4%); Avg. V=7.33 ft/s • Discharge by .6 methodQ3=1,510,000 cfs (+3.4%); Avg. V=7.88 ft/s • Uncertainty (Q2 vs. Q3): 6.6 - 7.1%
Selected References • Buchanan, T.J., and Somers, W.P., 1969, Discharge measurements at gaging stations: U.S. Geological Survey Techniques of Water-Resources Investigations, book 3, chapter A8, 65 p. • Rantz, S.E. and others, 1982, Measurement and Computation of Streamflow: Volumes 1 and 2, Geological Survey Water-Supply Paper 2175, Washington D.C., 631 p.