Download
1 / 28
280 likes | 460 Views
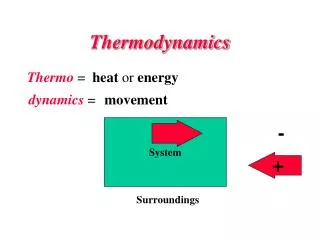
Thermodynamics. A system: Some portion of the universe that you wish to study. The surroundings: The adjacent part of the universe outside the system. Changes in a system are associated with the transfer of energy. Natural systems tend toward states of minimum energy. Basic Thermodynamics.

E N D
Thermodynamics • A system: Some portion of the universe that you wish to study • The surroundings: The adjacent part of the universe outside the system Changes in a system are associated with the transfer of energy Natural systems tend toward states of minimum energy
Basic Thermodynamics • The theoretical basis of phase equilibrium • Three Laws of Thermodynamics 1. First Law: Change inEnergydE = dQ – dW Q – heat energy W – work = F * distance (notice distance is a length) Pressure has units Force/Area = (F/dist2) so Work = F * dist = P * area * dist = P * V At constant pressure dW = PdV So if Pressure is constant: (1) dE = dQ – PdV where dV is thermal expansion or contraction Does not depend on path The symbol d means “the small change in”
Energy E • Kinetic + potential energy + Pressure energy + …. • Kinetic energy due particles motion (vibration (heat), rotation, translation) • Potential energy: position, rest mass energy, charge of atoms, energy of bonds. • Changed by heating or by doing work on system • Pressure energy = Pressure x unit Volume • First law: dE = dQ – dW , change in energy is equal to the total heat added/removed and work done by/on the surroundings. If the system is isolated from its surroundings, its energy cannot change.
Second and Third Laws of Thermodynamics 2. All substances move to the greatest state of disorder (highest Entropy ”S”) for a particular T and P. (2) dQ/T = dS “The state of greatest order [lowest S] is at the lowest temperature. With increasing temperature, disorder becomes more prevalent.” Minerals with simple atomic structure and simple chemistry have lower entropy. 3. At absolute zero (0ºK), Entropy is zero Does this suggest how to measure S? Can we measure changes in S by keeping track of temperature as we add heat to a system? “The entropy of a pure crystalline substance can therefore be obtained directly from heat-capacity measurements by assuming that S0 (at 0o K) is zero” Wood and Fraser (1978) p38
Stability of a phase (or mineral) is partly related to its internal energy (here “E”), which strives to be as low as possible under the external conditions. • Metastability exists in a phase when its energy is higher than P-T conditions indicate it should be. (1) • Activation Energy is the energy necessary to push a phase from its metastable state to its stable state. (2 minus 1) • Equilibrium exists when the phase is at its lowest energy level for the current P-T conditions. (3) (Two minerals that are reactive with one another, may be found to be in equilibrium at particular P-T conditions which on phase diagrams are recognized as phase boundaries) Note: most metamorphic and igneous minerals at the earth’s surface are metastable. Example: Exsolution of K-spar and Albite at low temperatures; they were in Solid Solution at higher temperatures.
Moles (mol) • A number ~6.022 x 10²³ of anything • A mole of a substance is equal to its molecular mass in grams. • Thus Aluminum has a molecular mass of ~26.98, so a mole of aluminum metal has a mass of 26.98 grams.
Enthalpy H • Enthalpy (symbol H) is the sum of internal energy plus work* related to changes in pressure and volume. • H = E + PV • The change in Enthalpy DH = Cp DT • Cp is the Heat Capacity at constant pressure P. Cp the amount of heat energy required to raise 1 mole of a substance by 1oC. SI units Joules • T is the Temperature in Kelvin *The energy required to "make room for it" by displacing its surroundings.
Entropy S • Entropy, S, is a measure of the disorder of a system. • Example: A liquid (maybe a melt) is more disordered than a solid. • SI units Joules/K
Gibbs Free Energy • Define G G = E + PV – TS The internal energy E might be thought of as the energy required to create a system in the absence of changes in temperature or volume. An additional amount of work PV must be done if the system is created from a very small volume in order to "create room" for the system. A system at constant temperature T will contain an amount of energy TS Gibbs is the energy in excess of that energy TS
Stability and Gibbs Free Energy G G = E + PV – TS and we just defined enthalpy H = E + PV so • G(p,T) = H − TS thermal energy minus Temp x disorder • Stable forms of a chemical system have the minimum possible Gibbs Free Energy • H is the Enthalpy, a measure of Thermal Energy • S is the Entropy, a measure of randomness, of probability
Changes • Thermodynamics treats changes • Regardless of path G = E + PV – TS • We should rewrite the equation for Gibbs Free Energy in terms of changes, D G • DG = E + PDV – TDS for P, T constant • DG = DH – TDS D = pronounced “delta” means “the change in” DH can be measured in the laboratory with a calorimeter. DS can also be measured with heat capacity measurements. Values are tabulated in books. The change in Gibbs free energy, ΔG, in a reaction is a very useful parameter. It can be thought of as the maximum amount of work obtainable from a reaction.
Gibbs for a chemical reaction Hess’s Law applied to Gibbs for a reaction 298.15K, 0.1 MPa • Suppose 3A + 2B = 2C +1D reactants = products • DG = 2GC +1GD -3GA – 2GB • Gibbs Free Energy (G) is measured in KJ/mol or Kcal/mol • One small calorie cal ~ 4.2 Joules J
Molar Gibbs Free Energy of Formation • G extensive, depends on amount • Make intensive by using molar free energy, Joules/mole • Measure H with calorimetry • and S (measure DQ/T from T = 0 to 298K and define S0K = 0). More precision at low T’s • Conditions 298K and 0.1 MPa = 1 bar are called “the reference state”. • For the reaction Si + O2 = SiO2 • Gf = Hf – TSf = -856.3 kJ/mol 298K and 0.1 MPa
Gibbs free energy of formation • The Gibbs free energy of formation is Gf° = Hf° - TfS° • For example, to calculate the Gibbs free energy of formation of anhydrite, CaSO4 , we can use Hf°CaSO4 = -1434.11 kJ/mole • S°CaSO4 = 106.7 J mol-1 K-1 • S°Ca = 41.42 J mol-1 K-1 Hfo Ca = 0 • S°S = 31.80 J mol-1 K-1 HfoS= small • S°O2 = 205.138 J mol-1 K-1 HfoO2= 0 • and we calculate the entropy of formation of anhydrite Sf° = S°CaSO4 - S°Ca - S°S - 2 * S°O2 = -376.796 J mol-1 K-1 • and then use Gf° = Hf° - TfSf° = -1434,110 - 298.15 * -376.796 = -1321.77 kJ/mol
G for reactions • DGR = DHR – TDSR • Again: For a reaction A B • That is, for reactants products • When DGR is negative the forward reaction has excess energy and will occur spontaneously A B • When DGR is positive there is not enough energy in the forward direction, and the back reaction will occur B A • When DGR is zero reaction is at equilibrium, both reactions occur equally.
Ex: Oxidation of Ferrous Iron, Fe+2 • Groundwater: iron in two oxidation states Reduced ferrous iron (Fe+2) Oxidized ferric iron (Fe+3). • Modern atmosphere 21% oxygen, so • most O2 in shallow soils ferric state, (Fe+3). • With time, mineralized. Fe+2 => Fe+3 Fe+3 is less soluble, forms oxides, hydroxides • Initially Ferric Hydroxide (Fe(OH)3) • amorphous hydrous ferric oxide (Fe2O3•xH2O), • Hematite (Fe2O3), and Goethite FeO(OH).
Gibbs Calc 1: Fe+2 => Fe+3 Oxidation of ferrous ion to ferric ion DG0R = DH0R – TDS0R H2O(l)=-63.32 kcal/mol = -63320 cal/mol You look these up in tables Reactants Products • Fe2+ + ¼ O2 + H+ Fe3+ + ½ H2O =[-4120+(-63320*0.5)]-[-21870+(3954*0.25)] =[-67440]-[-20887.5]=-46557.5 cal/mol Negative, so forward (left to right) reaction will proceed
Gibbs details d(uv) = udv + vdu • dE = dQ – PdV 1st Law • dQ/T = dS, so dQ = TdS 2nd Law G = E + PV – TS Differentiating dG = dE +PdV +VdP -TdS - SdT dE = dQ - PdV = TdS – PdV so dG = TdS – PdV + PdV + VdP -TdS – SdT dG = VdP –SdT All other terms cancel.
Gibbs Calc 2: SiO2 atelevated P and T • Suppose we want G for Quartz at 500oC and 500MPa • Doesn’t depend on path, can do Pressure and Temperature separately • dG = VdP –SdT we just saw. • Or approximately • DG = VDP –SDT • Gp2 – Gp1 = V(P2 – P1) if T, V const T constant means DT = 0, V constant is a good approximation for solids
Variation in Gibbs of a phase with T and P Doesn’t depend on path, do Pressure and Temperature separately PRESSURE calc, assume volume const for solids • Gp2 – Gp1 = V(P2 – P1) if T, V const For P2 = 500 MPa, P1 = 0.1 MPa, V = 22.69 x 10⁻⁶ m3, Gp1 = - 856,300 J (lo-qtz looked up in a table) Gp2 = Gp1 + V(P2 – P1) = -856,300J + 22.69 x10⁻⁶m3(500x106 – 0.1x10⁶Pa) = - 844,957 Joules ~ -845 KJ Data from Robie and Waldbaum (1970), not Table 5.1 in the text SiO2 atElevated P and T
Variations Gibbs of a phase with T and P Doesn’t depend on path, do Pressure and Temperature separately Assume S constant over change temperature error is small • DG = VDP –SDT • GT2 – GT1 = -S(T2 – T1) if P = 500 MPa const G500MPa, 773K = GT1 –S0.1MPa(773K – 298K) = -844957 J – 41.46 J/K (773 -298K) = -864650.5 Joules G SiO2 at500MPa and 773K ~ -864.7 KJ P constant means DP = 0, S constant is a rough approximation provided DT not too big
Gibbs Free Energy • We defined G– the energy of a system in excess of its internal energy E. This is the energy necessary for a reaction to proceed. H = E + PV G = E + PV – TS = H – TS Now let’s derive some useful relationships. Differentiating dG = dE +PdV +VdP -TdS - SdT dE = dQ - PdV = TdS – PdV so dG = TdS – PdV + PdV + VdP -TdS – SdT = VdP –SdT This is equation (3) dG = VdP –SdT If T = constant dT = 0, then dG = VdP (2) at constant T(dG/dP)T = V(dense (low V) phases are favoredat high P) If P = constant dP = 0, then dG = -SdT (3) at constant P(dG/dT)P = -S(disordered phases (high S) are favoredat high T) dQ =TdS is the 2nd law Reactions go to the phase with lower G
We saw (equation 3) that dG = VdP –SdT The Clapeyron Equation • defines the state of Equilibrium between reactants and products in terms of S and V From Eqn.3, if dG =0, dP/dT = ΔS / ΔV (eqn.4) The slope of the equilibrium curve on a P T diagram will be positive if S and V both decrease or increase with increased T and P The function G can be represented graphically on P T diagrams
Constructing Phase Diagrams One Component: H2O The Gibbs and Clapeyron Equations allow us to estimate phase diagrams with extrapolations from laboratory measurements. The lines show where equilibrium conditions (DG = 0) occur. Clapeyron tells us the slope Pressure-Temperature Phase Diagram
Dense (low V) phases are favoredat high P dP/dT = ΔS / ΔV Clapeyron Disordered phases (high S) are favoredat high T 1.Does the liquid or solid have the larger volume/unit mass? Usually liquid. (except H2O) Low V usually solid. 2. High pressure favors low volume, so which phase should be stable at high P? Solid 3.Does liquid or solid have a higher entropy? liquid 5. Both DV and DS increase to right. We can thus predict that the slope of solid-liquid equilibrium should be positive and that increased pressure raises the melting point. 4. High temperature favors randomness, so which phase should be stable at higher T? Liquid is more random, expect at high T.
Does the liquid or solid have the lowest G at point A? Solid, pt. A is in the solid field. What about at point B? Liquid, same argument Figure 5-2. Schematic P-T phase diagram of a melting reaction. Winter (2001) An Introduction to Igneous and Metamorphic Petrology. Prentice Hall. The phase assemblage with the lowest G under a specific set of conditions is the most stable
The Payoff • Our experiments and calculations allow us to construct the 3-D plot in (a), and to project the mineral with the lowest free energy at each PT onto the graph in (b). Notice the points a,b and c at right. At c, DG = 0 in the reaction Andalucite Sillimanite Nesse fig 5.3
The KSA Phase diagram allows us to assign PT conditions to various Plate Tectonic settings Of Nesse