Download
1 / 52
550 likes | 761 Views
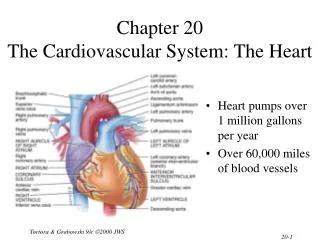
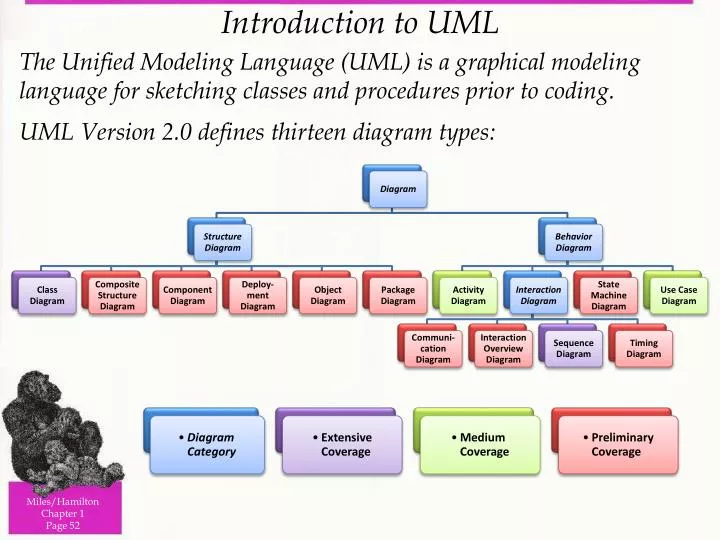
Introduction to UML. The Unified Modeling Language (UML) is a graphical modeling language for sketching classes and procedures prior to coding. UML Version 2.0 defines thirteen diagram types:. Miles/Hamilton Chapter 1 Page 52. The UML Diagrams. Miles/Hamilton Chapter 1 Page 53.

E N D
Introduction to UML The Unified Modeling Language (UML) is a graphical modeling language for sketching classes and procedures prior to coding. UML Version 2.0 defines thirteen diagram types: Miles/Hamilton Chapter 1 Page 52
The UML Diagrams Miles/Hamilton Chapter 1 Page 53
Kruchten’s 4+1 View Model One convenient way to view the suite of UML diagrams is Kruchten’s 4+1 view model, which separates the diagrams into five ways of viewing a software system: Miles/Hamilton Chapter 1 Page 54
Using UML in Iterative and Agile Development In iterative software development processes (e.g., incremental, spiral), UML diagrams are often used as a blueprint for the software system, providing detailed specifications to which the developers adhere. Agile software development, on the other hand, tends to use UML diagrams as a sketch for the software system, providing rough guidelines for the developers to follow. The Rational Unified Process was specifically developed to take advantage of UML’s features, with Use Case Diagrams playing a central role in the Requirements discipline and the other UML diagrams prominent in the Analysis & Design discipline. Miles/Hamilton Chapter 1 Page 55
Use Case Diagrams UML Use Case Diagrams assist developers in understanding customer and user software needs. The simple Use Case Diagram at right illustrates the interaction between various stick figure actors and several oval-shaped use cases in a restaurant system. Miles/Hamilton Chapter 2 Page 56
The Value of Use Case Diagrams Use Case Diagrams describe what a system does from the point of view of an external observer. Use Case Diagrams are helpful in three ways: • New use cases generate new requirements as the system is analyzed. • Their notational simplicity provides a good way to communicate with clients. • Collecting scenarios for a use case may suggest corresponding ideas for test cases. Miles/Hamilton Chapter 2 Page 57
An Example Use Case Diagram Arrowed associations indicate that the actor is invoking the use case, while non-arrowed associations merely signify that the actor is associated in some way with the use case. The <<extends>> relationship indicates that one use case might reuse the behavior of another use case, depending on how the system is implemented. Miles/Hamilton Chapter 2 Page 58
Another Example Use Case Diagram The <<inherits>> stereotype is used to indicate that the actor (or use case) is a more specialized version of the associated actor (or use case). This is called the generalization relationship. The <<includes>> relationship indicates that one use case definitely reuses all of the behavior of another use case. Miles/Hamilton Chapter 2 Page 59
One Final Example Use Case Diagram System boundary boxes can be drawn around use cases to indicate the scope of the system, e.g., to identify which use cases will be delivered in each major release of the software system. Miles/Hamilton Chapter 2 Page 60
UML Activity Diagrams UML Activity Diagrams model the flow of activity within a process (i.e., within a particular use case). The Activity Diagram at right illustrates the activities associated with withdrawing money from a bank account at an ATM. Miles/Hamilton Chapter 3 Page 61
Creating An Activity Diagram The Activity Diagram associated with the “Enroll In University” use case starts with three partitions (or swim lanes), one for each actor (the Applicant and the Registrar), as well as one for the system itself. Miles/Hamilton Chapter 3 Page 62
The Initial State The initial state (represented by the large black circle) starts in the swim lane of the actor invoking the use case. Arrows are used to illustrate the control flow, while rounded rectangles represent the actions taken by each actor. Miles/Hamilton Chapter 3 Page 63
Guards When a control flow is marked with text (called a guard), the associated condition must evaluate to true in order for that flow to be traversed. Miles/Hamilton Chapter 3 Page 64
Forks and Termination States The thick horizontal bar with multiple outgoing flows represents a fork, corresponding to the start of activities taking place in parallel. The circled black circle represents a termination state, a point at which the process ends. Miles/Hamilton Chapter 3 Page 65
Merges &Decisions A diamond with several entering control flows represents a merge, at which point any of the incoming flows would yield the same outgoing flow. A diamond with several outgoing control flows represents a decision, with conditions indicating which flow will be taken. Miles/Hamilton Chapter 3 Page 66
Notes Explanatory notes may be provided within the diagram to clarify the more complicated aspects of the model. Such notes are particularly helpful to customers and managers, but also assist developers during model reviews. Miles/Hamilton Chapter 3 Page 67
Joins The thick horizontal bar with multiple incoming flows represents a join, corresponding to the end of activities that were taking place in parallel. Miles/Hamilton Chapter 3 Page 68
UML Class Diagrams UML Class Diagrams describe a software system’s structure by illustrating its classes, their attributes, and their interrelationships. The diagram at right illustrates several of the principal features of a UML Class Diagram… Miles/Hamilton Chapter 4 Page 69
Class Boxes Each class box consists of three sections: the class name, the class attributes, and the class operations. Attributes are analogous to data members (+ is public, - is private, # is protected), while operations are analogous to member functions. Miles/Hamilton Chapter 4 Page 70
Associations Relationships between classes may have role names and multiplicities defined for each end. A role name is placed at the target class with an arrowhead. A multiplicity indicates how many objects may satisfy the property. Miles/Hamilton Chapter 4 Page 71
Generalizations Abstract superclasses and derived subclasses may be represented in UML Class Diagrams. A triangular arrowhead means that one class is derived from another, inheriting public and protected attributes and operations. Miles/Hamilton Chapter 5 Page 72
Aggregation and Qualification Aggregation is the “part of” relationship, while qualification refines the notion of multiplicity. In this example, the diamond-shaped aggregation marker means that each member institution in a consortium handles account verifications for at least one ATM, while the rectangular qualification marker signifies that each ATM is a part of a unique member institution within a consortium. Miles/Hamilton Chapter 5 Page 73
Notes As with Activity Diagrams, explanatory comments may be placed within Class Diagrams by means of notes. A dashed line connects the note to the diagram element that is being commented. Miles/Hamilton Chapter 5 Page 74
Composition This is the “is-a-vital-part-of” relationship. In this example, the form disappears when the game application is terminated, but not when the game is just over. Miles/Hamilton Chapter 5 Page 75
Parameters Parameters can be represented for a class. In agile development, where UML may just be used for sketching a model, this level of detail might be excessive. Miles/Hamilton Chapter 5 Page 76
Class Diagram Example: Breakout Game Brick Wall Side Ball Paddle Paddle Movement The familiar Breakout game affords a thorough example of several Class Diagram features. • Three balls per game • 10-point regular bricks, 20-point speed bricks • Speed bricks double ball’s speed • Reflection angle = entry angle (for flat surfaces) • Mean reflection for simultaneous collisions • “Invisible” bottom side causes loss of ball Miles/Hamilton Chapter 5 Page 77
Breakout Class Diagram: Generalizations It would make sense to set up a class hierarchy for all of the rectangular objects within the game. Note that operation parameters may be given a direction: in (input only), out (output only), or inout (both input and output). Miles/Hamilton Chapter 5 Page 78
Breakout Class Diagram: Aggregations The fundamental components of the game are defined. The wall has two types of bricks (regular and speed) and the playing field has two types of sides (regular and bottom), but that’s not reflected in this steady-state aggregate diagram. Miles/Hamilton Chapter 5 Page 79
Breakout Class Diagram: Associations The object interactions in the game are defined. Note how the Obstacle abstract superclass and the Invisible Side class both interact with the Breakout Game’s active ball. Miles/Hamilton Chapter 5 Page 80
Class Diagram Example: Thermostat Controller Another example of Class Diagram features is the embedded software for an industrial air conditioning unit. The controller sets the unit’s thermostat low when cool air is in greater demand (e.g., weekdays when the factory is in production) and high when it’s in less demand (during the evenings and overnight on weekdays, and at all times during weekends). Miles/Hamilton Chapter 5 Page 81
Thermostat Controller Parameters The factory manager may set the following parameters for the controller: • LowTemp: Goal temperature when heavy cooling is needed • HighTemp: Goal temperature when light (or no) cooling is needed • WeekendDays: Days when thermostat is set to HighTemp all day • PeakTimes: Ordered pair of times between which thermostat is set to LowTemp on non-WeekendDays • Mode: Controller state (possibilities: StayLow, StayHigh, Normal) Miles/Hamilton Chapter 5 Page 82
Thermostat Controller Class Diagram Four main objects interact in this system: the controller, the thermostat, the clock, and the time period. (We’ll view these interactions in greater detail when we examine UML Sequence Diagrams.) Miles/Hamilton Chapter 5 Page 83
UML Object Diagrams Object Diagrams clarify Class Diagrams by demonstrating example instances of the class. The potential confusion of the Class Diagram on top is alleviated by means of the concrete example in the Object Diagram on bottom. Miles/Hamilton Chapter 6 Page 84
UML Sequence Diagrams Sequence Diagrams illustrate the sequence of interactions between objects (or participants) in a software system. This diagram shows interactions between a customer and two software systems, using two form interfaces and an “order” object. Miles/Hamilton Chapter 7 Page 85
Lifelines Each object in a Sequence Diagram has a lifeline that indicates its overall activity as the diagrammed interactions progress. Notice that the Order object is created during one interactive sequence, so its lifeline begins lower in the diagram. Miles/Hamilton Chapter 7 Page 86
Messages Interaction between objects is represented in a Sequence Diagram by horizontal arrows representing procedure calls. The initial message coming from outside of the system is called a “found message”, coming from an undetermined source. Miles/Hamilton Chapter 7 Page 87
Activation Bars Vertical activation bars are used to indicate that processes are being performed in response to messages. While activation bars are optional in UML 2, they tend to clarify the behavior taking place within a system. Miles/Hamilton Chapter 7 Page 88
Return Messages Return messages may be explicitly represented within a Sequence Diagram. Dashed backward arrows represent explicit return messages; missing backward arrows indicate implicit returns. Miles/Hamilton Chapter 7 Page 89
Subprocesses Nested activation bars represent subprocesses within a Sequence Diagram. Nesting of processes is often rendered implicitly, in order to avoid overcomplicating the Sequence Diagram. Miles/Hamilton Chapter 7 Page 90
Synchronous Messages Some messages require responses before a process can proceed. One reason to show explicit responses is to emphasize which messages are synchronous (filled triangle arrowhead). Miles/Hamilton Chapter 7 Page 91
Asynchronous Messages Processes may proceed without awaiting responses for some messages. Asynchronous messages are represented with stick arrowheads (usually with implicit return messages). Miles/Hamilton Chapter 7 Page 92
Interaction Frames Loops and conditionals may be represented in Sequence Diagrams via interaction frames. This interaction frame represents a loop that restricts the number of times a user may check his balance on an ATM. Miles/Hamilton Chapter 7 Page 93
Sequence Diagram Example: Thermostat Controller Recall the thermostat controller Class Diagram example: There are basically two ways to model the passage of time in this example: The polling approach requires the controller to be constantly active, even when it has nothing productive to do. The notification approach allows the controller to idle until needed and gives the responsibility for checking time to an actual timing device. The clock repeatedly notifies the controller when a certain amount of time has passed The controller polls the clock to see if the desired amount of time has passed Miles/Hamilton Chapter 7 Page 94
Adjusting The Thermostat Controller The primary Sequence Diagram for the thermostat controller involves adjusting to a new setting. Note that this action occurs only when the controller is in Normal mode at a time at the beginning or ending of the PeakTimes interval. Miles/Hamilton Chapter 7 Page 95
UML Communication Diagrams Communication Diagrams basically illustrate the same information as Sequence Diagrams, but with an emphasis on the inter-object relationships rather than the order in which messages are processed. Miles/Hamilton Chapter 8 Page 96
UML Timing Diagrams Timing Diagrams model the behaviors of one or more objects throughout a specific period of time. Deliver Material Request Material Timing Diagrams are particularly useful when designing embedded software, such as the control software in a car’s fuel injection system. Miles/Hamilton Chapter 9 Page 97
UML Interaction Overview Diagrams Interaction Overview Diagrams are variants of Activity Diagrams in which the nodes represent other interaction diagrams rather than actions taken by the system’s actors. The internal interaction diagrams may be in-line (e.g., the Sequence Diagrams marked “sd”) or referenced (those marked “ref”). Miles/Hamilton Chapter 10 Page 98
UML Composite Structure Diagrams Composite Structure Diagrams are used to illustrate the internal workings of a class, including its parts (i.e., its attributes), its ports (i.e., its interaction with its environment), and its interfaces (i.e., behaviors that collaborating classes must meet). Interfaces come in two categories: provided interfaces, which supply the specified operations, and required interfaces, which need the specified operations (as pictured in the simple Composite Structure Diagram at left). Miles/Hamilton Chapter 11 Page 99
UML Component Diagrams Component Diagrams are used to model a high-level perception of the planned software system, with each component within the diagram ultimately implemented as multiple classes. Note that the Component Diagram at right makes use of required and provided interfaces. The dashed arrow between the Account’s AccountDetails interface and the Order’s Payment interface signifies that while the Account does not provide the required Payment data, there is a dependency between the AccountDetails and the Payment. Miles/Hamilton Chapter 12 Page 100
UML Package Diagrams To simplify complex Class Diagrams, logically related classes may be grouped into “packages” in a Package Diagram. One package depends on another if changes in the latter might force changes in the former. Miles/Hamilton Chapter 13 Page 101