Download
1 / 45
450 likes | 575 Views
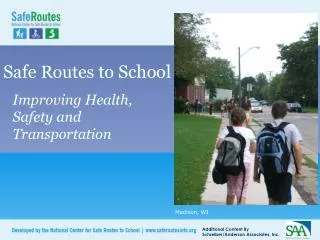
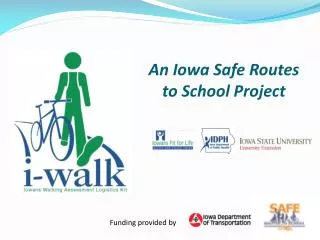
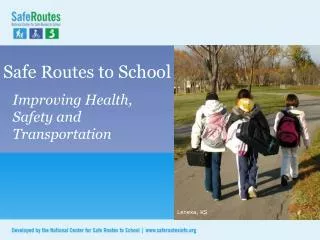
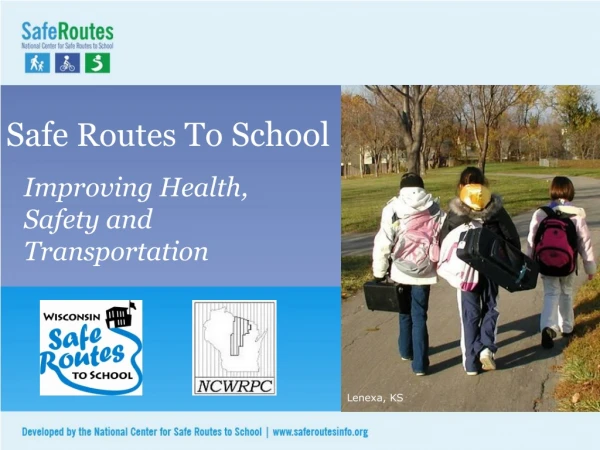
An Iowa Safe Routes to School Project. Funding provided by. National Safe Routes to School Program. Improving Health, Safety and Transportation. Hull, IA- Students assisting adults with I-WALK walkability assessment. April 2011. Fewer kids are biking and walking. More parents are driving.

E N D
An Iowa Safe Routes to School Project Funding provided by
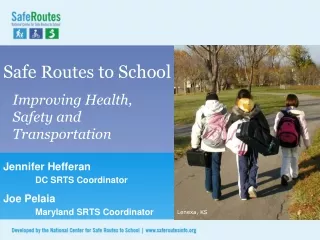
National Safe Routes to School Program Improving Health, Safety and Transportation Hull, IA- Students assisting adults with I-WALK walkability assessment. April 2011
Fewer kids are biking and walking. More parents are driving. • 2009: 13% walked • 1969: 48% walked (National Center for Safe Routes to School, 2011)
School siting issues: a generation ago • A generation ago: Small schools, located in community centers (EPA, 2003) • Today: Mega-schools, built on edges of towns and cities
School consolidation has lengthened the trip between home and school
It’s not just distance Students who live within 1 mile and walk or bike: 2009: 35% 1969: 89% (National Center for Safe Routes to School, 2011)
Most common barriers to walking and bicycling to school • Long distances 62% • Traffic danger 30% • Adverse weather 19% • Fear of crime danger 12% Note: Sum of percentages is more than 100% because respondents could identify more than one barrier. (CDC, 2005)
Unintended Consequences: Physical inactivity • Most kids aren’t getting the physical activity they need • Recommended 60 minutes on most, preferably all, days of the week (US Depts. of Health and Human Services and Agriculture, 2005)
Overweight children have an increased risk of… • Lower academic success • Type 2 Diabetes • Low self esteem • Decreased physical functioning • Obesity in adulthood • Negative emotional & physical effects
Safe Routes to School programs are part of the solution… • to improve walking and bicycling conditions • to increase physical activity • reduce congestion around schools • can lead to cost savings for schools (reduce need for “hazard” busing) • increase child’s sense of freedom • help establish lifetime habits • teach pedestrian and bicyclist skills • reduce pollution
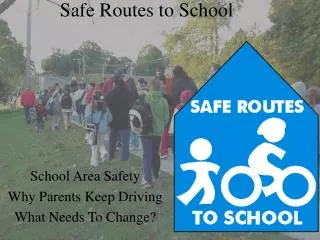
Safe Routes to School goals • Where it’s safe, get children walking and biking • Where it’s not safe, make changes Winston-Salem, NC
An Iowa Safe Routes to School Project Funding provided by
I-WALK Partnership & Goal To develop a sustainable model for community coalitions to continuously update, implement, and evaluate the local Safe Routes to School (SRTS) plan.
I-WALK Components • Community coalition • Evaluation • Teacher Tally • Parent/Child Online Survey • GPS Walkability Assessment • Presentation of data results to community Hull, IA- Students assisting adults with I-WALK walkability assessment. April 2011
1. Community Coalition • Local public health • School representatives: teachers, principals, parent, student • Citizens: grandparents, community organizations and clubs • DNR, Parks and recreation department • Public safety, school resource officer, law enforcement • Area Agency on Aging • City/county planners and other city representatives • Other • Atlantic, IA- I-WALK GIS/GPS training in preparation for walkability assessment. March 2011
2a. Evaluation: Teacher Tally • Determines how students get to and from school
2b. Evaluation: Parent & Student Online Survey • Identifies current routes students take to/from school with mapping feature • Identifies barriers to walking or biking to school
2c. Evaluation: GPS Walkability Assessment • Coalition and community members walk routes identified by the parent & student survey • iPhone with GPS capabilities are used to collect data and sent back to ISU Extension for analysis
GPS: Sidewalk & Intersection Assessment Checking for sidewalks on both sides. Paper map showing Assessment area assigned. Intersectionassessment.
3. Presentation to Community • Presentation of final report • Next steps for SRTS
I-WALK Communities • *2010-11 SY: 2 communities in each of the 6 PH Regions • *2012 Spring: 4 communities • *2012-12 SY: 12 TBD additional communities • Reach • *2700 in 3rd-5th grade • *5,000 students in buildings • *35,000 students in district • * 220,000 students/adults in district Spring 2012 Grantees 2010-11 Grantees
I-WALK GPS Walkability Assessment • Welcome & Introductions • I-WALK Overview • Data Collection – What you are collecting today • Hands on GPS Training • GPS Collection • Review Data & Wrap up
Questions? i-walk.org
Mapping 3 Types of Features Midpoints (Diamonds) Intersections (+Circles) Random (Iconic)
Groups assigned to collection zones. Volunteers assigned to zone A collected data at every midblock and intersection that was within the zone A boundary. When in doubt on a zone boundary, collect the data!! Others will see that the point has been collected. Remember, you only need to locate one symbol at each location. For the midblock it references the sidewalks on both sides of the street. B A D C
Random Features: Random features can be located at any time. The only form item is an optional comment
Sidewalk Curbcuts Riceville, IA (April, 2011)
Sidewalk Ending Kalona, IA (May, 2011) Riceville, IA (April 2011)
Vegetation Encroaching Sidewalk Riceville, IA (April, 2011)
Sidewalk with Steps Atlantic, IA (March, 2011)
Mark on map crosswalks that are not at the intersection as well as locations where crossing guards are stationed Note – this is a photo from GPS workshop in Riceville! The iPhone Camera Works very well! Riceville, IA (April, 2011)
Lifted, broken & cracked sidewalks Note – You do not have to photograph every broken/cracked sidewalk. Just the major ones that are in major need of repair! Tabor, IA (April, 2011) Tabor, IA (April, 2011)
Lifted, broken & cracked sidewalks Note – You do not have to photograph every broken/cracked sidewalk. Just the major ones that are in major need of repair! Tabor, IA (April, 2011) Tabor, IA (April, 2011)
Silly stuff Riceville, IA (April, 2011)
Hands on Training • Hand out devices • Record Device Numbers • Walk through demo • Test GPS locator • If you have questions when in the field you can call 515-509-0651