Download
1 / 16
160 likes | 287 Views
Tracking Development Aid : Innovations in Data Visualization and Prospects for Tracking Aid for Climate Change Adaptation. Dr. Catherine Weaver University of Texas at Austin. CCAPS Research Areas. Climate change vulnerability. 1. Climate change vulnerability model

E N D
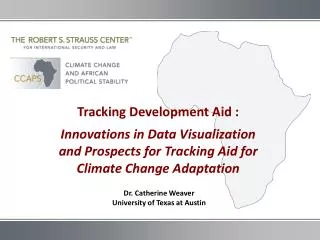
Tracking Development Aid : Innovations in Data Visualization and Prospects for Tracking Aid for Climate Change Adaptation Dr. Catherine Weaver University of Texas at Austin
CCAPS Research Areas Climate change vulnerability 1. Climate change vulnerability model 2. Climate projection model 3. Social Conflict in Africa Database 4. Armed Conflict Location and Event Data 5. Constitutional design and conflict management 6. Democratic governance 7. Emergency response capacity 8. Tracking and Geomapping Climate Change Adaptation Aid Climate and conflict Governance International aid
CCAPS The Politics of Data:Empirical Challenges to Tracking and Geomapping Climate Aid
CCAPS Step 1: Overcome the poverty of subnational project level data on ODA flows An example: Malawi
CCAPS An example: Malawi Water Water Agriculture Agriculture
CCAPS CCAPS Step 2: Geocoding • Use of AidData geocoding methodology (used in World Bank Mapping for Results initiative) • Ability to geocode dependent on quality of project documents (huge variation across donors)
CCAPS Step 3: Climate Coding • No established robust coding or reporting method for capturing adaptation aspects of ODA projects • Adaptation is usually integrated or mainstreamed into traditional development projects • Debate over “what counts as adaptation” and what kind of adaptation (or maladaptation) exists within projects
2011 Pilot Study: Malawi • MOU with Ministry of Finance in Malawi (Jan.2011) • Identification of ODA projects (all donors, all sectors) through AMP system developed by Development Gateway • Fieldwork conducted in March and 2011 to collect all active project documents (~800) from 29 ODA donors reporting to the AMP system • Geocoding conducted by team of CCAPS and AidData interns, summer-fall 2011 • Climate Coding in progress – to be vetted by expert group in November 2011 at CCAPS Climate Aid Tracking Workshop • “Groundtruthing” and further qualitative fieldwork in 2012-2014. • Scaling Up: All-Africa Geocoding and Climate Coding by 2015.
CCAPS EARLY RESULTS
Locations of individual projects for all ODA donors • Dynamic maps • All sorts of overlays and data mash-ups possible
CCAPS Next Steps: CCAPS Data Dashboard
Why Aid Data Visualization Matters • Enhance donor-donor and donor-recipient coordination. • Strengthen country ownership, project feedback and accountability. • Facilitate development planning and budget management. • Provide powerful analytical tool for scholarship on aid, climate change and development. • Help to determine whether UNFCCC commitments to “new and additional finance” are being met and whether adaptation and mitigation aid is targeting the most vulnerable areas.