Download
1 / 27
320 likes | 634 Views
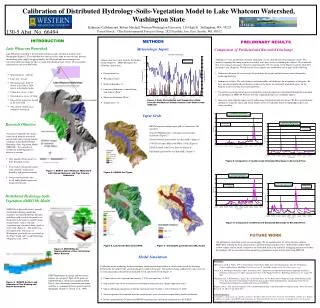
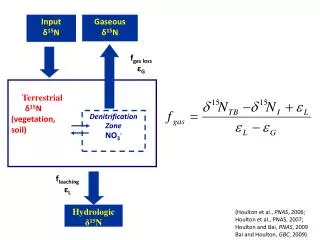
Distributed Hydrology-Soil-Vegetation Model (DHSVM). Physically based hydrologic model Grid based (DEM) Two layer canopy for vegetation Simultaneously solves energy and water balance. Forest Harvest and Road Construction Hard and Ware Creeks, WA.

E N D
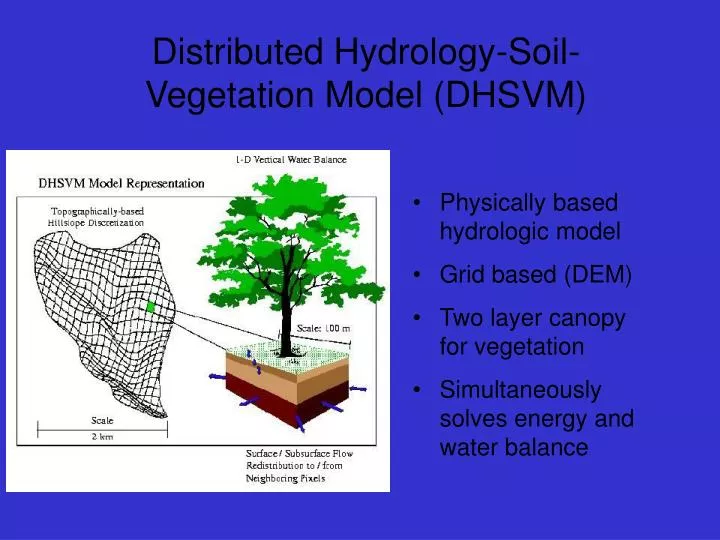
Distributed Hydrology-Soil-Vegetation Model (DHSVM) • Physically based hydrologic model • Grid based (DEM) • Two layer canopy for vegetation • Simultaneously solves energy and water balance
Forest Harvest and Road ConstructionHard and Ware Creeks, WA
Forest Harvest and Road ConstructionHard and Ware Creeks, WA
SWE difference for February 1996ROS event; harvest - no harvest More snow at beginning of event Less snow at end of event
Simulated response to forest harvestSub-basins of the Deschutes River, WA
Effect of forest roads on water table Drier with roads Wetter with roads
Simulated streamflow w/ and w/o forest roads Hard Creek Ware Creek Hard Creek Ware Creek
Sediment Modeling with the DHSVM Watershed Sediment Module DHSVM MASS WASTING SURFACE EROSION CHANNEL EROSION Qsed Q OUTPUT Watershed Sediment Module
Portraying Watershed ChangeSediment Model Effect of wildfire on simulated root cohesion Wildfire in the Icicle Creek basin
Probability of slope failure before and after Fourth of July Fire Pre-fire Approximate extent of August 2001 fire Post-fire Icicle Creek Vegetation
Portraying Watershed ChangeStream Temperature Model tree height bank-to- canopy canopy height buffer width buffer width
Simulated 10 year maximumstream temperatures 23.21 23.2 22.3 23.4 23.3 23.2 24.1 24.8 23.3 25.1 • Wenatchee River 5th field watersheds • Current conditions Temperatures in degrees Celsius
Recreating spatial harvest history: Historical data (top) GAP analysis (bottom) based on Landsat TM
Assessment of time history of catchment area with immature stands Source: Connelly et al. (1993) and GAP 1991 Classified Landsat TM Landcover dataset
Predicting the effects of lakes and wetlands • Lake energy balance based on: • Hostetler and Bartlein (1990) • Hostetler (1991) • Assumptions: • One “effective” lake for each grid cell; • Laterally-averaged temperatures; and
Wetland Algorithm soil saturated land surface runoff enters lake evaporation depletes soil moisture lake recharges soil moisture
Lakes and wetlands Source: San Diego State University Global Change Research Group
Putuligayuk River Landcover from Landsat MSS images (Muller et al. 1999).
Change in surface saturation June 2000 September 2000
Use of Synthetic Aperture Radar (SAR) imagery: • Change in saturated area over time • Storage volume of saturated area • Parameterization of hydrologic model
RadarSATSAR ground truth data Surveyed areas Prudhoe Bay Betty Pingo site Basin boundary Putuligayuk River 10 km
Saturated extent from RADARSAT - Putuligayuk River, Alaska 2000 = wet = dry a. b. c. d. e.
Simulated mean annual evaporationPutuligayuk River, Alaska with lake algorithm without lake algorithm • Simulated annual evaporation increases by 60%