Download
1 / 6
60 likes | 157 Views
OPTION TO REMAIN COMPARISON ATTENDANCE 2008-2009. Attendance is measured by minutes In 08-09: Semester 1 general population attendance = 90% Semester 1 OPT attendance = 90% Semester 1 non OPT a ttendance = 90% Semester 2 general population attendance = 89% Semester 2 OPT attendance = 88%

E N D
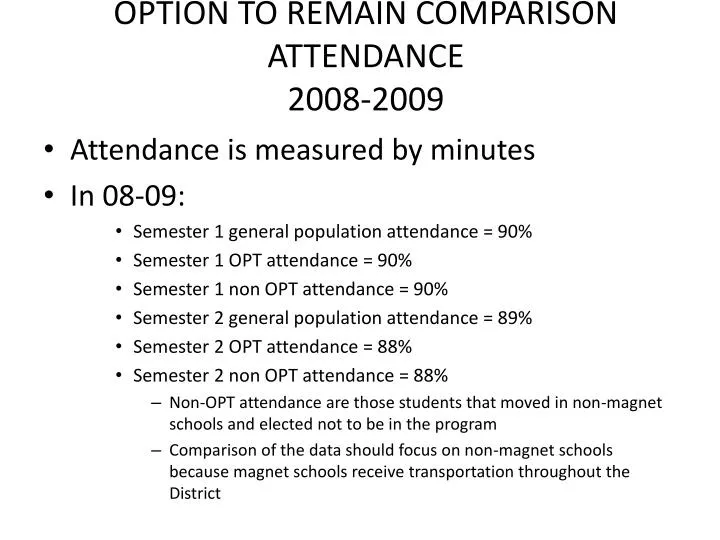
OPTION TO REMAIN COMPARISON ATTENDANCE2008-2009 • Attendance is measured by minutes • In 08-09: • Semester 1 general population attendance = 90% • Semester 1 OPT attendance = 90% • Semester 1 non OPT attendance = 90% • Semester 2 general population attendance = 89% • Semester 2 OPT attendance = 88% • Semester 2 non OPT attendance = 88% • Non-OPT attendance are those students that moved in non-magnet schools and elected not to be in the program • Comparison of the data should focus on non-magnet schools because magnet schools receive transportation throughout the District
OPTION TO REMAIN COMPARISON ACADEMIC GRADES2009-2009 • Children that moved and elected to be in the Option to Remain program received better grades than those that moved and elected not to be in the program • Compared to the general population of the non-magnet schools, a higher percentage of students in the OPT program received grades “C” and received lower failing grades
OPTION TO REMAIN COMPARISONMAP2008-2009 • Only certain grades are tested in the MAP • Of those tested, in the proficient and advanced areas: • The percentage of students in the OPT program in Communication Arts was lower than the students that moved and were not in the program along with the general population • The percentage of students in the OPT program in Mathematics was higher that the students that moved and were not in the program but the same for the general population