Download
1 / 16
160 likes | 256 Views
Monitoring of Transatlantic Long Range Transport of Tropospheric NO 2 – Observation and Simulation. Bas Mijling Bart Dils Ronald van der A Ruud Dirksen. Part 1 Observation. Observation LRT with satellites. Why tropospheric NO 2 ? Relatively easy to measure Relation with tropospheric O 3

E N D
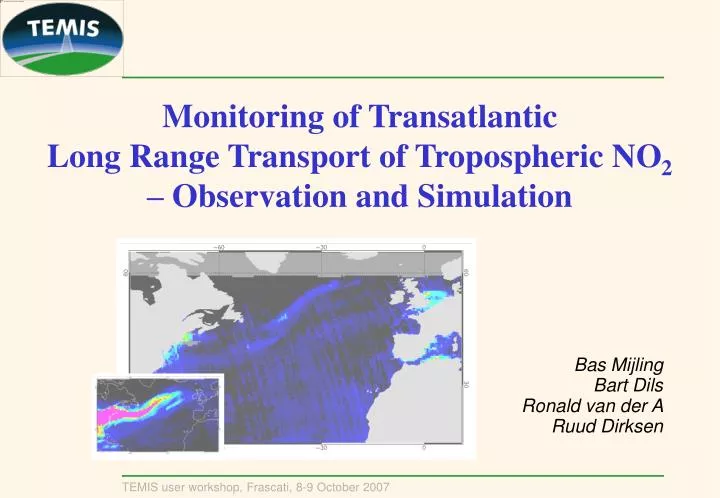
Monitoring of TransatlanticLong Range Transport of Tropospheric NO2– Observation and Simulation Bas Mijling Bart Dils Ronald van der A Ruud Dirksen
Part 1 Observation
Observation LRT with satellites • Why tropospheric NO2? • Relatively easy to measure • Relation with tropospheric O3 • Why OMI? • Daily global coverage; high resolution • Why Atlantic region? • Predominant westerly winds transport air pollutants from East US to West Europe
Basic mechanism of long range transport East Asian outflowof tropospheric NO2observed by OMI26 May 2007 1. Rapid uplift 2. Fast horizontal transport
Shielding effects of clouds NO2 above the clouds troposph. NO2 column NO2 ghost column Surf. albedo 0.02 Cloud at 800 hPa
Event I: Transatlantic NO2 transport 2-12-2005 3-12-2005 4-12-2005 5-12-2005
Event II: Transatlantic NO2 transport 22-12-2005 23-12-2005 24-12-2005 25-12-2005
Event III: Backflow from Europe 6-2-2007 7-2-2007 8-2-2007 9-2-2007
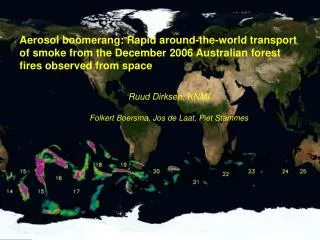
Event IV: Forest fires on the Canaries 29-7-2007 30-7-2007 31-7-2007 1-8-2007
Data quality: OMI collection 3 • Level 0-1: Improved dark current correction • Level 1-2: Averaged solar irradiance spectrum Collection 2 Collection 3 • Improved signal to noise ratio (noise floor now at ~0.2 1015 molec/cm2) • No cross-track gradient (no artifacts at overlapping tracks) • Still some striping problem (to be corrected for with filter)
Part 2 Observation & Simulation
OMI observation / FLEXPART simulation Flexpart, 14 Jan 2007 OMI, 14 Jan 2007 OMI less sensitive to NO2 in lower troposphere
OMI observation / FLEXPART simulation Flexpart, 6 Jan 2007 OMI, 6 Jan 2007
http://www.temis.nl/lrt • Height dependency • Frequency (seasonality) • Quantify transport
Future activities • Reprocessing OMI data using collection 3 • Implementation destriping filter • New data-format (HDF5 instead of ASCII) • Other areas (East Asia, South Africa, …) • Other satellite instruments (GOME-2) • Quantifying transport • Correlation with background stations
Thank you for your attention! www.temis.nl/lrt See you at: