Download
1 / 12
130 likes | 217 Views
2012 NYS HIV Quality of Care Program. Learning Network QI Project Updates. Quality Improvement Project Focus. Adolescent Quality Learning Network-VL Suppression & Transitioning Care Substance Use Learning Network-VL Suppression Community Health Center QLN-VL Suppression & Retention

E N D
2012 NYS HIV Quality of Care Program Learning Network QI Project Updates
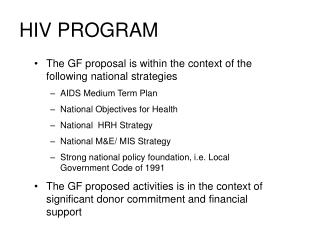
Quality Improvement Project Focus • Adolescent Quality Learning Network-VL Suppression & Transitioning Care • Substance Use Learning Network-VL Suppression • Community Health Center QLN-VL Suppression & Retention • HHC QLN-Linkage to care, retention & VL suppression
Secondary Drivers Housing Primary OutcomePrimary Drivers Substance Use Psycho-Social Support Mental Health Appointments Increase the viral load suppression rate by 10% across clinics over a 10 month period Retention Transportation Continuity of care Staff attitude ARV Adherence Treatment Education Health Literacy Health Insurance
2012 Community Health Center Quality Learning Network Viral Load Suppression QI Project Network Viral Load Suppression QI Project 9/7/12 Dan Belanger Team IHI IA Score: 3.5 Predicted Score by 12/31/12: 4.1
Community Health Center Quality Learning Network HIV Viral Load Suppression QI Project Retention Psycho-Social Support Appointments Housing Transportation Substance Use Continuity of care Mental Health Staff attitude Case management/ SW Support Staff/patient communication Improve the VL Suppression rate by 10% across 7 community health centers by 12/31/12 Patient support network Clarity of purpose-goals, roles, responsibilities Treatment education Clinic QM infrastructure Health literacy Health insurance Clinic environment Self efficacy Staff communication Clinic flow consumer involvement Clinic system/processes ARV Adherence
# whose most recent VL during the Jan-March period is >200 #initiated with QI intervention as of 4/1/2012 # who received a post-initiation viral load test # with a successful intervention Site – Cohort 1 patients # who are suppressed GHV – 8 patients IFH – 47 patients OD – 9 patients
% of unsuppressed patients who received a QI intervention before 4/1/12 and a most recent viral load test since with a suppressed viral load test result
QI Interventions Tested • Addressed adherence at medical and Mental Health appointments • one-on-one education • checklist of intervention items • patient questionnaire • case conference • Increased adherence counseling • DOT • Viral Load Visuals • teach back • phone call adherence counseling • increasing clinic attendance (every 4-6 weeks)
Shewhart Chart Exercise: Providers agreed to begin to investigate using Shewhart Charts for QIA follow up webinar will be scheduled in July Clinic Five Clinic Five was well known for using incentives to improve various aspects of care. They had never incentivized adherence to ARV treatment regimen, however, until doing an eHIVQUAL review, and seeing that the viral load suppression rate was less than 40% clinic wide. They came up with a plan, broadly advertising incentives for adherence measured by a suppressed viral load. All patients with a suppressed viral load at their next visit would get a $50.00 gift card from a major credit card company that could be used almost anywhere to buy almost anything. They noticed a major increase in the viral load suppression rate. Unfortunately the gift cards were a one-time donation from the credit card company, so the incentives were not sustainable and neither was the increase in the viral load suppression rate. They believe the data showed that the incentives showed an improvement based on the data. Do you agree? If you agree, please circle the area on the chart where the “special cause” occurred, showing significant improvement, and based on this background information annotate the chart. What is the rule that proves that this change is due to a special cause rather than a common cause?
Next Steps • A webinar to further discuss understanding variation over time through the use of the Shewwhart chart will be scheduled • We will share QI project outcomes such as the rate of unsuppressed patients involved in QI interventions across clinics • We will also share with providers viral load suppression rates Sharing aggregate data on PDSA cycles with providers Co-facilitate analysis of data from tests • In addition we will share with providers results from other learning networks involved in QI activities to improve viral load suppression • We will assist providers in negotiating challenges
Thanks to Leah Savitsky Andrew Lai Wei Miranda Rosenberg Chris Reisig Claire McCullough Johanna Buck Darryl Ng Ron Moen Clemens Steinbock, IA Mentor Bruce Agins. IA Sponsor
And… Beth Bonacci JoAnn Beasley FAYS Team Marc Slifer Janice Bigler SU Section Terry Hamilton Judy Yan Eunice Casey HHC Team