Download
1 / 55
550 likes | 739 Views
Ecosystems. Chapter 28. Ecosystems. Chapter 28. Fig. 41-1, p.730. Ecosystem . An association of organisms and their physical environment, interconnected by ongoing flow of energy and a cycling of materials. Modes of Nutrition. Autotrophs Capture sunlight or chemical energy Producers

E N D
Ecosystems Chapter 28
Ecosystems • Chapter 28 Fig. 41-1, p.730
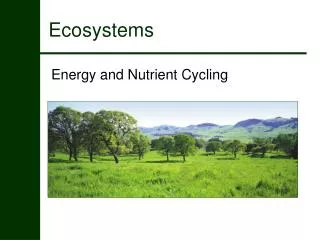
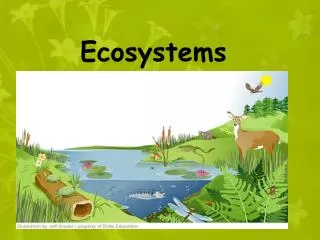
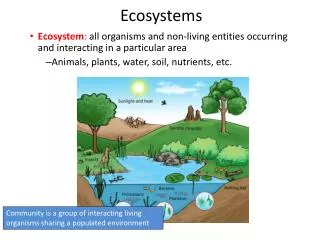
Ecosystem An association of organisms and their physical environment, interconnected by ongoing flow of energy and a cycling of materials
Modes of Nutrition • Autotrophs • Capture sunlight or chemical energy • Producers • Heterotrophs • Extract energy from other organisms or organic wastes • Consumers, decomposers, detritivores
Simple Ecosystem Model Autotrophs (plants, other self-feeding organisms) Heterotrophs (animals, most fungi, many protists, many bacteria) (mainly metabolic heat)
Consumers • Herbivores • Carnivores • Parasites • Omnivores • Decomposers • Detritivores
Omnivores, Red FoxDiet fluctuations due to Seasonal variation in diet fruits rodents, rabbits insects SPRING birds fruits rodents, rabbits insects SUMMER birds fruits rodents, rabbits insects FALL birds fruits insects rodents, rabbits birds WINTER
Trophic Levels • All the organisms at a trophic level are the same number of steps away from the energy input into the system • Producers are closest to the energy input and are the first trophic level
Trophic Levels in Prairie Fourth-level consumers (heterotrophs): Top carnivores, parasites, detritivores, decomposers 5th Third-level consumers (heterotrophs): 4th Carnivores, parasites, detritivores, decomposers Second-level consumers (heterotrophs): 3rd Carnivores, parasites, detritivores, decomposers First-level consumers (heterotrophs): 2nd Herbivores, parasites, detritivores, decomposers Primary producers (autotrophs): 1st Photoautotrophs, chemoautotrophs
Food Chain marsh hawk • A straight line sequence of who eats whom • Simple food chains are rare in nature upland sandpiper garter snake cutworm flowering plant
Energy Losses • Energy transfers are never 100 percent efficient • Some energy is lost at each step • Limits the number of trophic levels in an ecosystem
Energy Losses The mouse receives energy from the food it eats. • Cells extract the food's energy for growth, acquiring food, escaping enemies lost as heat. • Some of the energy that is in the food is lost in the mouse's waste (feces). • The remaining energy is stored in the mouse's body and is available to the organism that preys on it. • About 90% of the energy is used or lost, only 10% is available to predators.
Grazing Food Web Detrital Food Web Two Types of Food Webs Producers (photosynthesizers) Producers (photosynthesizers) decomposers herbivores carnivores detritivores decomposers ENERGY OUTPUT ENERGY OUTPUT
Biological Magnification A nondegradable or slowly degradable substance becomes more and more concentrated in the tissues of organisms at higher trophic levels of a food web * Dichloro-Diphenyl-Trichloroethane (DDT) * Polychlorinated biphenyls (PCBs)
DDT in Food Webs • Synthetic pesticide banned in the United States since the 1970s • Birds that were top carnivores accumulated DDT in their tissues
PCBs in Food Webs • PCB concentrations in animal tissue can be magnified up to 25 million times. • Microscopic organisms pick up chemicals from sediments • Consumed in large numbers by filter feeding zooplankton. • Mysid shrimp then consume zooplankton • fish eat the mysid • and so on up the food web to the herring gull. • (Figure and caption from Our Stolen Future, p. 27)
DDT Detection • In 1962, Rachel Carson, a former U.S. Fish and Wildlife Service (USFWS) scientist and writer, published Silent Spring, outlining the dangers of DDT Fig. 41-8, p.736
DDT in Food Webs • Heinz Meng • Responsible for the reintroduction of the Peregrine Falcon.
DDT residues • Why was there never a concern for the Ring-billed gulls? Fig. 41-7, p.736
Primary Productivity • Gross primary productivity is ecosystem’s total rate of photosynthesis • Net primary productivity is rate at which producers store energy in tissues in excess of their aerobic respiration
Primary Productivity Varies • Seasonal variation • Variation by habitat • The harsher the environment, the slower plant growth, the lower the primary productivity
Biomass Pyramid (energy) • Aquatic ecosystem in Florida • Site of a long-term study of a grazing food web third-level carnivores (gar, large-mouth bass) 1.5 second-level consumers (fishes, invertebrates) 11 first-level consumers (herbivorous fishes, turtles, invertebrates) 37 5 primary producers (algae, eelgrass, rooted plants) 809 decomposers, detritivores (bacteria, crayfish)
ENERGY INPUT Silver Springs: Annual Energy Flow 17,000,000 kilocalories incoming solar energy not harnessed: energy transfers through ecosystem 1,679,190 (98.8%) 20,810 (1.2%) producers energy losses as metabolic heat and as net export from the ecosystem: transferred to the next trophic level: energy still in organic wastes and remains: 3,368 4,245 13,197 herbivores 383 720 2,265 carnivores 21 272 90 top carnivores 5 16 decomposers, detritivores 5,060 20,810 + 1,679,190 ENERGY OUPUT: TOTAL ANNUAL ENERGY FLOW: 1,700,000 (100%)
Pyramid of Energy Flow • Primary producers trapped about 1.2 percent of the solar energy that entered the ecosystem • 6-16% passed on to next level top carnivores decomposers + detritivores = 5,060 21 carnivores herbivores 383 3,368 producers 20,810
Primary Productivity Although average productivity per unit surface area is lower than on land, Total productivity on land and in seas is about equal..Due to amount of water coverage. (Red high Purple lowest)
All Heat in the End • At each trophic level, the bulk of the energy received from the previous level is used in metabolism • This energy is released as heat energy and lost to the ecosystem • Eventually, all energy is released as heat
Biogeochemical Cycle • The flow of a nutrient from the environment to living organisms and back to the environment • Main reservoir for the nutrient is in the environment
Three Categories • Hydrologic cycle • Water • Atmospheric cycles • Nitrogen and carbon • Sedimentary cycles • Phosphorus and sulfur
Hydrologic Cycle Atmosphere precipitation onto land 111,000 wind-driven water vapor 40,000 evaporation from land plants (evapotranspiration) 71,000 evaporation from ocean 425,000 precipitation into ocean 385,000 surface and groundwater flow 40,000 Oceans Land
Hubbard Brook Experiment • A watershed was experimentally stripped of vegetation • All surface water draining from watershed was measured • Removal of vegetation caused a six-fold increase in the calcium content of the runoff water
Hubbard Brook Experiment losses from disturbed watershed plot time of deforestation
Aquifer Depletion • Green signifies high overdrafts • Gold, moderate overdrafts • Yellow, insignificant withdrawals • Shaded areas show groundwater pollution • Blue squares: saltwater intrusion
Carbon Cycle • Carbon moves through the atmosphere and food webs on its way to and from the ocean, sediments, and rocks • Sediments and rocks are the main reservoir
volcanic action photosynthesis TERRESTRIAL ROCKS weathering Carbon Cycle diffusion Atmosphere Bicarbonate, carbonate Terrestrial rocks Land food webs Marine food webs Soil water Peat, fossil fuels Marine Sediments
Carbon in the Oceans • Most carbon in the ocean is dissolved carbonate and bicarbonate • Ocean currents carry dissolved carbon
Carbon in Atmosphere • Atmospheric carbon is mainly carbon dioxide • Carbon dioxide is added to atmosphere • Aerobic respiration, volcanic action, burning fossil fuels • Removed by photosynthesis
Greenhouse Effect • Greenhouse gases impede the escape of heat from Earth’s surface
Carbon Dioxide Increase • Carbon dioxide levels fluctuate seasonally • The average level is steadily increasing • Burning of fossil fuels and deforestation are contributing to the increase
Other Greenhouse Gases • CFCs - synthetic gases used in plastics and in refrigeration • Methane - produced by termites and bacteria • Nitrous oxide - released by bacteria, fertilizers, and animal wastes
Greenhouse Gases carbon dioxide methane nitrous oxide CFCs
Global Warming • Long-term increase in the temperature of Earth’s lower atmosphere
Nitrogen Cycle • Nitrogen is used in amino acids and nucleic acids • Main reservoir is nitrogen gas in the atmosphere
Nitrogen Fixation • Plants cannot use nitrogen gas • Nitrogen-fixing bacteria convert nitrogen gas into ammonia (NH3) • Ammonia and ammonium can be taken up by plants
Ammonification & Nitrification • Bacteria and fungi carry out ammonification, conversion of nitrogenous wastes to ammonia • Nitrifying bacteria convert ammonium to nitrites and nitrates
Nitrogen Loss • Nitrogen is often a limiting factor in ecosystems • Nitrogen is lost from soils via leaching and runoff • Denitrifying bacteria convert nitrates and nitrites to nitrogen gas