Download
1 / 36
360 likes | 491 Views
2000 to 2013 Population and Components of Change Estimates for Maryland. Presented to the State Data Center Affiliates Meeting June 12, 2014. Mark Goldstein Maryland Department of Planning. U.S. Census Bureau’s Annual Population Estimates (Typical Timeline Release).

E N D
2000 to 2013 Population and Components of Change Estimates for Maryland Presented to the State Data Center Affiliates Meeting June 12, 2014 Mark Goldstein Maryland Department of Planning
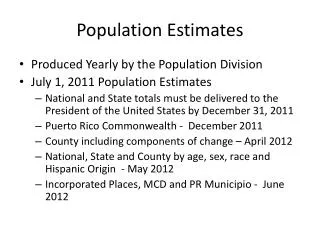
U.S. Census Bureau’s Annual Population Estimates (Typical Timeline Release) • States - December of estimated year • Counties - March following estimated year • Municipalities– May following estimated year • Age, race and gender - June following estimated year (states and counties)
U.S. Census Bureau’s Annual Population Estimates (Methodology) • Cohort component methodology for states and counties • Births & deaths - from administrative records • Net domestic migration (tax returns and Medicare records) • Net international migration – ACS data
Estimated Annual Total Population Change for Maryland* Source: U.S. Census Bureau population estimates
Estimated Annual Percent Population Change for Maryland and the U.S.* Maryland U.S. Source: U.S. Census Bureau population estimates
Births in Maryland Source: U.S. Census Bureau population estimates
Deaths in Maryland Source: U.S. Census Bureau population estimates
Net Natural Increase for Maryland Source: U.S. Census Bureau population estimates
Estimated Net Domestic Migration for Maryland * Source: U.S. Census Bureau population estimates
Median Value of Owner-Occupied Homes Year 2000
Median Value of Owner-Occupied Homes Year 2008 Year 2000
Change in Median Value of Owner-Occupied Homes: 2000 to 2008
Change in Median Value of Owner-Occupied Homes: 2008 to 2011
Estimated Net International Migration for Maryland * Source: U.S. Census Bureau population estimates
Population Change, 2012-2013 Top 2 = 50% Top 4 = 72% Top 5 = 80%
Population Change: April 1, 2010 – July 2013 Top 2 = 46% Top 4 = 69% Top 5 = 81% Source: U.S. Census Bureau population estimates
Share of Statewide AnnualPopulation Change * Source: U.S. Census Bureau population estimates
Net Domestic Migration Estimates * Source: U.S. Census Bureau population estimates
Net International Migration Estimates * Source: U.S. Census Bureau population estimates
Annual Population Change and Net Domestic Migration for Montgomery County Source: U.S. Census Bureau population estimates
Annual Population Change and Net Domestic & International Migration for Montgomery County Source: U.S. Census Bureau population estimates
Annual Population Change and Net Domestic Migration for Prince George’s County Source: U.S. Census Bureau population estimates
Annual Population Change and Net Domestic Migration for Carroll Co. Source: U.S. Census Bureau population estimates
Annual Population Change and Net Domestic Migration for Cecil Co. Source: U.S. Census Bureau population estimates
Annual Population Change and Net Domestic Migration for Washington County Source: U.S. Census Bureau population estimates
Summary • Growth trends & migration patterns are still being affected by the Great Recession and its aftermath • Growth is more concentrated in Central MD jurisdictions, less in exurban/rural counties • Net domestic migration has greatest impact on year-to-year population changes