Download
1 / 40
490 likes | 1.01k Views
Electrons Inside The Atom. Ionization and Excitation Franck-Hertz Experiment Energy Levels and Spectra Photoelectric Effect. Ionization and Excitation. Ionization is the process of creating charged atoms.

E N D
Electrons Inside The Atom Ionization and Excitation Franck-Hertz Experiment Energy Levels and Spectra Photoelectric Effect
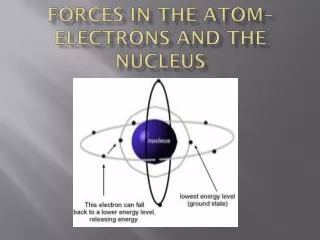
Ionization and Excitation • Ionization is the process of creating charged atoms. • Excitation is the process whereby atoms absorb energy without ionization. The orbital electrons are raised to the next energy level.
Franck-Hertz Experiment (1) http://phys.educ.ksu.edu/vqm/free/FranckHertz.html • The diagram below shows the apparatus used in the experiment.
Mercury vapour in the tube Collector electrode Heated cathode A Grid V Franck-Hertz Experiment (2) • The circuit diagram shows the basis of the experiment. e
9.8 V 4.9 V Current /mA 0 Accelerating p.d. /V Franck-Hertz Experiment (3) • The experimental results are shown below.
Franck-Hertz Experiment (4) • From the graph, it can be obtained that 1. At the beginning the current increases with the accelerating potential difference. 2. Up to a critical value (4.9 V for mercury) of the accelerating p.d., there was a sudden drop in the current. 3. Then the current increases again and another sudden drop occurred at 9.8 V. 4. The current rises and drops again periodically as the accelerating p.d increases. 5. The peaks of the graph have equal spacing. • It was also noticed that light was emitted by the mercury during the sudden drop in current.
Franck-Hertz Experiment (5) • Interpretation of the experimental results: • Usually, the electrons collide with the mercury atom elastically so there is no loss in kinetic energy. • For the critical value the electrons lost all their kinetic energy on hitting the mercury atoms due to inelastic collision and the mercury atoms are then excited. When they do, those electrons do not reach the anode and the current drops. • Further increase in the accelerating p.d. leads to an increased current, until another is reached. • Each peak represents an inelastic collision with energy exchange between the free electrons and the mercury atoms.
12 10 8 6 4 2 0 Ionisation 10.4 8.8 7.8 430 nm Energy /eV 4.9 180 nm 250 nm Discrete Energy Levels • Some of the energy levels of mercury and the wavelengths that can be emitted.
Photoelectric Effect • Thephotoelectric effectis the emission of electrons when light strikes a surface. • The emitted electrons are called photoelectrons. • The photoelectrons absorb energy from the incident radiation and thus able to overcome the attraction of positive charges.
Ultraviolet radiation Zinc plate Gold leaf A Simple Demonstration of Photoelectric Emission (1) • Ultraviolet radiation is directed onto a clean zinc plate placed on the cap of a gold-leaf electroscope as shown below. the electroscope is given a negative charge so the leaf rises http://chem107.chem.tamu.edu/brown/shockpages/photoelectric.html
A Simple Demonstration of Photoelectric Emission (2) • Firstly the electroscope is given a negative charge so the leaf rises. • When ultraviolet radiation is allowed to fall on the zinc plate, the leaf gradually falls because the electroscope loses charge. • Free electrons in the zinc plate gain sufficient energy to leave the plate.
A Simple Demonstration of Photoelectric Emission (3) • If the electroscope is made positive to start with, then the leaf will not fall because no loss of charge takes place. • The free electrons in the zinc plate need much more energy to leave the zinc plate because it is charged positively and the radiation cannot supply enough energy.
Anode Monochromatic light Cathode Investigations of Photoelectric Effect (1) http://jce.divched.org/JCEDLib/WebWare/collection/open/photoelectric/peeffect5.html • The diagram below shows the arrangement to investigate photoelectric effect. http://lectureonline.cl.msu.edu/~mmp/kap28/PhotoEffect/photo.htm
Investigation of Photoelectric Effect (2) • From the investigations it was found that • When monochromatic light fell on the cathode, no photoelectrons were emitted unless the frequency of the light was greater than some minimum value called threshold frequency. • When the frequency of light f is greater than the threshold frequency, some electrons are emitted from the cathode with substantial initial speeds.
Overhead view with E-field reversed A E Investigation of Photoelectric Effect (3) • By reversing the direction of the E-field, it can be shown that the highest energy electrons still can reach the anode if the E-field is not too great.
The maximum kinetic energy, , of the photoelectrons can be determined by making the potential of the anode to cathode, , just negative enough so that the current stops. is called the , where • This occurs for stopping potential. • It can be shown that. Investigation of Photoelectric Effect (4)
i 2I I 0 Variation of Photocurrent with Voltage for Light of Constant Frequency (1) • The diagram below shows graphs of photocurrent as a function of potential difference (Accelerating voltage) for light of constant frequency and different intensities.
Variation of Photocurrent with Voltage for Light of Constant Frequency (2) • From the graphs, it can be shown that • When the accelerating voltage is sufficiently large and positive, the curves level off, showing that all the emitted electrons are being collected by the anode. • If the light intensity is increased while its frequency is kept the same, the current levels off at a higher value, showing that more electrons are being emitted per second. • The stopping potential is found to be the same. That is the maximum kinetic energy of the electrons is not proportional to the light intensity. http://chem107.chem.tamu.edu/brown/shockpages/photoelectric.html
i 0 Variation of Photocurrent with Voltage for Light of Different Frequencies (1) • The graphs below show the variation of photocurrent with the accelerating voltage for different frequencies, with the same intensity of light.
Variation of Photocurrent with Voltage for Light of Different Frequencies (2) • From the above graphs, we see that • When the frequency of the light is increased, the stopping potential increases. • The maximum kinetic energy depends on the frequency of the incident light since it has been shown that
1. When the light intensity increases, electrons should be able to gain more energy, increasing the stopping potential , But was found not to depend on intensity. 3. We would expect it to take a while for an electron to collect enough energy from extreme faint light but experiment shows that electrons are emitted as soon as any light with hits the surface. Wave Theory predictions for the Photoelectric Effect • According to the classical theory, 2. The intensity of an electromagnetic wave such as light does not depend on frequency, so an electron should be able to acquire its needed escape energy from light of any frequency.
2. The energy of a photon, . where h is a universal constant called Planck’s constant. h = 6.626 x 10⁻³⁴ Js 4. Electrons are held in the metal by attractive forces, some minimum energy , called the work function, is required just to get an electron out through the surface. Einstein’s Theory of Photoelectric Emission (1) • A beam of light consists of small packages of energy • called photonsor quanta. 3. A photon arriving at the surface is absorbed by an electron. This energy transfer is an all-or-nothing process.
6. Greater intensity at a particular frequency means a proportionally greater number of photons per second absorbed, thus a proportionally greater number of electrons emitted per second. or 5. If the frequency f of the incoming light is so high that the electron may escape from the surface. Einstein’s Theory of Photoelectric Emission (2) 7. Applying the law of conservation of energy,
/e Relationship between The Stopping Potentialand the Frequency of Light http://www.walter-fendt.de/ph11e/photoeffect.htm • The graph below shows how the stopping potential varies with the frequency of the incoming light.
Uses of Photoelectric Cells • Photodiode • Optical sound track on movie film • Photo-voltaic cells • Photo-conductive cells (LDR)
Types of Spectra (1) • Continuous Spectra • Continuous spectra consist of a continuous range of colours from deep red to deep blue. • When an element is heated up, the atoms vibrate so much that their energy levels becomes spread out. The atoms emits a continuous range of photon energies and hence wavelengths. • A continuous spectrum can be used to determine the temperature of the source.
Types of Spectra (2) http://jersey.uoregon.edu/vlab/elements/Elements.html • Line Emission Spectra • Line emission spectrum consists of thin vertical lines of different colours, set against a dark background. Each line corresponds to one value of wavelength. • The atoms emit photons of certain energies only. • Each photon is emitted when an electron in an atom moves from one energy level to a lower energy level.
Types of Spectra (3) • Absorption Spectra • Absorption spectra consist of dark vertical lines against a background of continuous spectrum. • When white light passes through a gas, an electron moves from a low energy level to a higher level as a result of absorbing a photon of energy equal to the difference of the two energy levels. • The absorption spectrum is like the negative of the emission spectrum.
Solar Spectrum http://antwrp.gsfc.nasa.gov/apod/ap000815.html • The solar spectrum consists of a continuum with thousands of dark absorption lines superposed. • The lines are called the Frauenhofer lines, and the solar spectrum is sometimes called the Frauenhofer spectrum. • These lines are produced primarily in the photosphere.
Hydrogen Spectrum (1) • The hydrogen spectrum can be observed using a spectrometer to view light from a hydrogen-filled discharged tube. 434 nm 656 nm 486 nm 410 nm
Hydrogen Emissioin and Absorptioin Spectrum • The absorption and emission spectra are complementary.
Hydrogen Spectrum (2) • In 1885 Johann Balmer discovered an equation which describes the emission-absorption spectrum of atomic hydrogen: • 1 / l = R(1 / 4 - 1 / n2) where n = 3, 4, 5, 6, ... • R=1.097107 m-1, and is called the Rydberg constant • Balmer found this by trial and error, andhad no understanding of the physicsunderlying his equation.
Transition between energy levels in a hydrogen atom http://www.bigs.de/en/shop/anim/termsch01.swf (Continuum)
Energy Levels • Later experiments on hydrogen showed that Where n and m are integers. Light of wavelength is emitted as atom jumps from level m to level n.
Energy Equation • When an atom jumps from level m to level n, a single photon of light is emitted whose energy is given by • The nth level of a hydrogen atom is given by • Ground state energy of hydrogen = -13.6 eV
Continuum • If an electron is given enough energy it can escape from the atom. • The electron is then unbound and the quantization of energy levels disappears. • The hydrogen atom is said to be ionized if the electron is promoted into the continuum. • Ionization energy of hydrogen = 13.6 eV.