Download
1 / 17
180 likes | 272 Views
Trends in Regional Traffic Volumes: Signs of Change?. East-West Gateway Council of Governments March 20, 2008. What is VMT and Why Should We Care?.

E N D
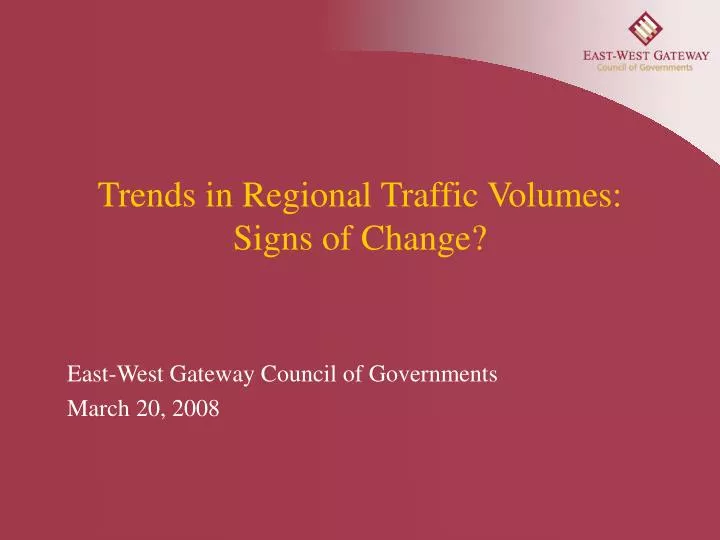
Trends in Regional Traffic Volumes:Signs of Change? East-West Gateway Council of Governments March 20, 2008
What is VMT and Why Should We Care? • Vehicle Miles Traveled (VMT) is an indicator of regional mobility. It’s a measure of the total number of miles driven by all vehicles in the region. • VMT is often an indicator of congestion. • VMT is useful in deciding when, where and whether new roads, or additional lanes on existing roads, need to be built. • To the extent that gasoline taxes constitute the principal source of funding for transportation projects, changes in VMT can significantly affect transportation financing.
VMT Trends • The long term trend for VMT has generally been characterized by rapid growth. • Beginning early in this decade VMT growth started to slow in the region. At the national level the trend appears to have begun mid-decade. • There do remain local "hot spots" where traffic volume does continue to increase. However, these high volume areas may not represent the entire region.
Annual Average Daily Vehicle Miles Traveled EWG Region 4.3% Average Annual Growth 2.3% Average Annual Growth .7% Average Annual Growth 80,000,000 70,000,000 .3% Average Annual Growth 60,000,000 Vehicle Miles Traveled 50,000,000 40,000,000 30,000,000 1980 1981 1982 1983 1984 1985 1986 1987 1988 1989 1990 1991 1992 1993 1994 1995 1996 1997 1998 1999 2000 2001 2002 2003 2004 2005 Year Source: MODOT, IDOT
Urban Vehicle Miles Traveled, US 4.0% Average Annual Growth 2.7% Average Annual Growth 2.7% Average Annual Growth 2,500,000 2,000,000 .1% Annual Growth 1,500,000 VMT (millions) 1,000,000 500,000 0 1980 1981 1982 1983 1984 1985 1986 1987 1988 1989 1990 1991 1992 1993 1994 1995 1996 1997 1998 1999 2000 2001 2002 2003 2004 2005 2006 Years SOURCE: US Department of Transportation, Federal Highway Administration
Vehicle Miles Traveled, US 2.4% Average Annual Growth 1.6% Average Annual Growth 4.1% Average Annual Growth 3,100,000 .6% Annual Growth 2,900,000 2,700,000 2,500,000 VMT (millions) 2,300,000 2,100,000 1,900,000 1,700,000 1,500,000 1982 1983 1984 1985 1986 1987 1988 1989 1990 1991 1992 1993 1994 1995 1996 1997 1998 1999 2000 2001 2002 2003 2004 2005 2006 Year SOURCE: FHWA, TRAFFIC VOLUME TRENDS, MAY 2007
Tractor Trailer Vehicle Miles Traveled, US 3.2% Average Annual Growth 3.7% Average Annual Growth 1.2% Average Annual Growth 160,000 140,000 .9% Annual Growth 120,000 100,000 VMT (millions) 80,000 60,000 40,000 20,000 0 1980 1981 1982 1983 1984 1985 1986 1987 1988 1989 1990 1991 1992 1993 1994 1995 1996 1997 1998 1999 2000 2001 2002 2003 2004 2005 Year
Demographic Factors Affecting VMT Growth • Population Growth • Age of the Population • Household Composition • Labor Force Participation • Vehicle Availability
Population Growth Population Growth Rates (Percent) EWG Region US 1970-1980 -2.5 11.4 1980-1990 2.8 9.8 1990-2000 3.9 13.2 1970-2000 4.2 38.4 Annual Percent Growth Rate, 1970- 2000 0.1 0.82 Source: US Census
Age of the Population Annual Miles Driven, US Age of Driver Annual Miles 0-15 353 16-19 6,638 20-24 13,982 25-29 15,902 30-34 16,265 35-39 16,309 40-44 15,817 45-49 15,674 50-54 14,733 55-59 13,753 60-64 12,124 65+ 8,223 Source: National Household Travel Survey, 2001
Household Composition Annual Miles per Driver by Household Type Number of Adults Child Present Miles per Driver 1 No 11,687 1 Yes 13,848 2 No 12,775 2 Yes 15,339 Source: National Household Travel Survey, 2001
Labor Force Participation Female Labor Force Participation Rates – 1960 thru 2045 70 60 50 40 Percent 30 20 10 0 1960 1964 1968 1972 1976 1980 1984 1988 1992 1996 2000 2004 2008 2012 2016 2020 2024 2028 2032 2036 2040 2044 Years Source: BLS 2002 Age Adjusted Labor Force Participation Rates, 1960-2045
Vehicle Availability Percentage of Occupied Housing Units With No Available Vehicle 1980 1990 2000 2006 Madison 9.1 8.7 7.0 5.2 Monroe 7.1 5.0 3.3 --- St. Clair 14.9 13.2 10.4 8.2 Franklin 7.5 6.8 5.9 4.1 Jefferson 4.5 4.3 4.3 4.2 St. Charles 3.7 6.0 3.6 3.5 St. Louis County 5.7 6.0 6.4 6.0 St. Louis City 31.2 29.1 25.2 21.6 Region 12.4 11.0 9.2 --- Source: US Census
Gas Prices Monthly Gas Prices and VMT - 1992 thru 2006 350 300 250 200 Billions Gas Prices Measured in Pennies and VMT Measured in 150 100 Gas Price, 2007 dollars VMT*1 Billion 50 0 JAN96 JAN97 JAN98 JAN99 JAN00 JAN01 JAN02 JAN05 JAN06 JAN92 JAN93 JAN94 JAN95 JAN03 JAN04 Year
Conclusions • Several demographic trends suggest that VMT growth will be moderate, and we are not likely to ever see a return to the growth rates of past decades: • Female labor force participation rates have stabilized. • The working-age population is likely to decline in absolute terms over the next decade. • The number of two-parent households with children is declining. • Auto ownership rates are not likely to rise dramatically in the future. • Gasoline prices may add a further incentive to reduce driving.
Trends in Regional Traffic Volumes:Signs of Change? East-West Gateway Council of Governments March 20, 2008