Download
1 / 69
690 likes | 795 Views
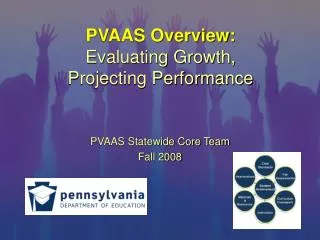
PVAAS Overview: Evaluating Growth, Projecting Performance Webinar. PVAAS Statewide Core Team Fall 2011. Goal of Session. To provide educators with an understanding of the Pennsylvania Value-added Assessment System and the meaning and uses of the following reports. Web-based Scatter Plots

E N D
PVAAS Overview:Evaluating Growth,Projecting PerformanceWebinar PVAAS Statewide Core Team Fall 2011
Goal of Session To provide educators with an understanding of the Pennsylvania Value-added Assessment System and the meaning and uses of the following reports. • Web-based Scatter Plots • District/School Value-Added Report • Value-added Summary Report • District/School Performance Diagnostic Report • Individual Student Projection Report • Projection Summary Reports
Agenda What is PVAAS? Scatterplots PVAAS Value-added Reports Going Deeper with Value-added PVAAS Projections Lines of Inquiry Resources and Support
PVAASIS: • Analysis of existing assessment data • Longitudinal PSSA scores in available content areas • Math, Reading, Science, Writing • Provides reliable estimates • A measure of a school’s effectiveness • Critical Relationship: Growth Data vs. Achievement Data
PVAAS: • Is not another test Critical concept • Is not a comparison of single test scores
Review of Literature Is there a relationship between… • Demographics vs. Achievement? YES • Demographics vs. Growth? NO Demographics are inherently controlled for in PVAAS due to the use of all longitudinal data on students!
Current Data Collection Approaches High Achievement Average Achievement Low Achievement Achievement is based on each student’s ending point.
PVAAS Adds Another Variable To Achievement…GROWTH! Below Growth Standard At or Above Growth Standard Growth is based on each student’s starting point!!
Scatter Plot Quadrants and Their Meanings Quad 2 - Slipping Adequate Achievement Negative Growth Quad 1 - Excelling Adequate Achievement Positive Growth Quad 4 - Improving Below Adequate Achievement Positive Growth Quad 3 - Underperforming Below Adequate Achievement Negative Growth
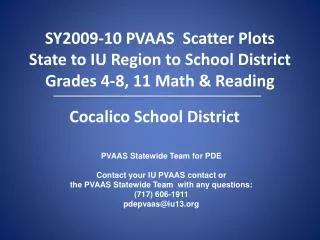
Example: Regional Scatter Plot: Same Schools, Different Subject
NEW! Web-based Scatter Plots! • Users may choose to plot different variables against achievement and/or growth! • This includes demographics such as: • % Tested Economically Disadvantaged • % Tested Limited English Proficiency • % Tested Special Education • % Tested Minority
TWO Types of PVAAS Information Looking Forward/Planning… PVAAS Projection Reports For Individual Students and Groups of Students Looking Back/Evaluation… Value-added Growth Reports For Groups of Students Today
Value-added Wouldn’t it be great to know if your district/school met the standard for PA Academic Growth for students tested in grades 4-8? And in Grades 9-11?
Growth Standard MethodologyMath & Reading – Grades 4 through 8
A Child’s Growth Chart This growth chart shows a little girl who is at the 15th percentile on her 1st birthday. Her growth is typical if she stays at the 15th percentile in later years.
Now at 3 years old… Growth Spurt! X TypicalGrowth X X Growth Concern?
A Challenge Comparing Scores Across YearsMath & Reading – Grades 4 through 8 • 0 10 20 30 40 50 60 70 80 90 100 NCE (Normal Curve Equivalent) Units 1000 1100 1200 1300 1400 1500 Scaled Score Units
What Value-Added Growth Measure Means!Growth Standard MethodologyMath & Reading – Grades 4 through 8 Achievement 6th grade 52.7 Achievement 5th grade 47.6 0 10 20 30 40 50 60 70 80 90 100 NCE Scale State Mean = 50 PVAAS Growth Measure ≈ Change in position from 5th to 6th grade ≈ 52.7 – 47.6 ≈ 5.1 NCE units
Example of Growth Measure=0 for a low-achieving district/school Example of Growth Measure=0 for a high-achieving district/school
Predictive MethodologyMath & Reading – Grades 11Writing – Grades 5, 8, 11Science – Grades 4, 8, 11
PVAAS Value-added ReportsWriting, Science & Grade 11 Math and Reading Predictive Methodology • A predicted score for each student; • Mean of predicted scores for the group of students; • Mean of observed scores for the group of students. Growth Measure ≈ Observed Mean - Predicted Mean
PVAAS Growth Reporting • District/School Value-added Report • Value-added Summary Report • District/School Performance Diagnostic Report • Performance Diagnostic Report for subgroups
District/School Value-added ReportGrades 4 through 8: Math & Reading Question for Educators: Are all grade levels meeting the standard for PA Academic Growth?
District/School Value-added ReportGrades 9-11 Math & Reading; Science; & Writing Question for Educators: Are all grade levels meeting the standard for PA Academic Growth?
District Value-added Summary ReportGrades 4 through 8: Math & Reading Question for Educators: Which schools at which grade levels are exceeding the standard for PA Academic Growth?
District Value-added Summary ReportGrades 9-11 Math & Reading; Science; & Writing Question for Educators: Which schools at which grade levels are exceeding the standard for PA Academic Growth?
Lines of Inquiry • Main Questions Regarding PVAAS Reports • Are we serving all students adequately? • Are we serving all students equitably? • Questions to Ask Regarding Value-added Reports • Are students in all grade levels across all schools meeting or exceeding the standard for PA Academic Growth in all subjects? • Is the pattern of growth at the same grade level consistent from school to school? Or, does growth differ from school to school within the same grade level? • For each school, is the pattern of growth at the same grade level consistent from year to year? Or, has growth differed within the same grade level across the last three years?
Going DeeperPerformance Diagnostic Report Missing Bar – Insufficient Number of Students Blue Bar – Current Year Gold Bar – Previous Years Whisker – Margin of Error on Growth Value Question for Educators: Are all groups of students making adequate growth?
PVAAS Performance Diagnostic Growth Descriptors - Interpretation What the whiskers tell us… Exceeded the standard for PA Academic Growth Blue Met the standard for PA Academic Growth Green Zero (0) Line Growth Did not meet the standard for PA Academic Growth Pink
Let’s Look at Our Example to Practice Interpretation Questions for Educators: • Are all types of learners showing a year’s growth or meeting expectations? • Are we serving all students adequately? • Are we serving all students equitably?
Links to students in selected predicted PSSA performance category Link to all students reported for this subject.
Student Lists from Performance Diagnostic Reports Current PSSA Performance level for each student
Patterns of Growth • Questions for Educators: • What patterns of growth do we see at the various grade levels? • What implications does this have for future achievement levels of students? • What implications does this have for closing he achievement gap? A C B
Lines of Inquiry • Questions to Ask Regarding Grade Level Performance Diagnostic Reports • Are students at all predicted PSSA performance levels meeting or exceeding the standard for PA Academic Growth in all grades and subjects? • What type of growth pattern do we see for each grade level? And, what are the implications for achievement if this growth pattern continues? • Where are we doing well? Which groups are showing positive growth? • Where are we facing challenges? Which groups are not showing positive growth? • Is there a change from previous years? • Are other buildings within the district seeing similar growth patterns? • What does this tell us about the standards-aligned system, specifically around curriculum, instruction, resources, and interventions?
Best to Compare Subgroup to Entire Grade Level Same School – Same Grade – Same Subject Entire grade level Subgroup Question for Educators: How do our subgroups compare to the entire grade level?
Lines of Inquiry • Questions to Ask Regarding Diagnostic Reports for Subgroups • Did the students in the selected subgroup achieve acceptable growth? What about those students predicted to be Below Basic? Predicted to be Basic? Predicted to be Proficient? Predicted to be Advanced? • Is the growth pattern for subgroups similar to the growth pattern for all students in the same grade level? • How do these growth patterns compare to subgroup growth patterns in other grade levels and subject areas? • Is there a change from previous years? • Are other buildings within the district seeing similar growth patterns with subgroups? • What does this tell us about the standards-aligned system, specifically around curriculum, instruction, resources, and interventions?
TWO Types of PVAAS Information Looking Forward/Planning… PVAAS Projection Reports For Individual Students and Groups of Students Looking Back/Evaluation… Value-added Growth Reports For Groups of Students Today
Student Projections Wouldn’t it be great to know the likelihood that a student will be proficient on a future PSSA?
Student Projection Methodology • Is this the same methodology as the one used to estimate growth? • No, the projection methodology is a separate modeling process that focuses on individual students. • What data are used in this methodology? • ALL available longitudinal data in both Reading and Math are used in projection calculations for all four subjects. • What students have projections? In what subjects? • Projections are available for all students who have a minimum of 2 years of historical data. The next slide details the grade levels and subjects in which projections are reported.