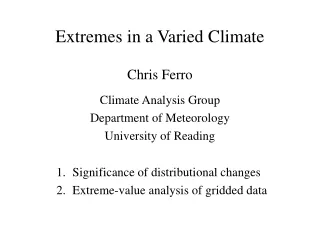
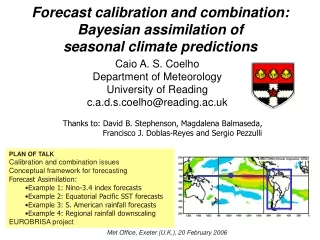
Download
1 / 22
220 likes | 275 Views
Multiscale Data Assimilation for High Resolution Nested Models. Gillian Baxter University of Reading Departments of Mathematics and Meteorology Supervisors: N. K. Nichols, S. L. Dance, A. S. Lawless, S. P. Ballard Sponsored by NERC and CASE studentship with the Met Office. Contents

E N D
Multiscale Data Assimilation for High Resolution Nested Models Gillian Baxter University of Reading Departments of Mathematics and Meteorology Supervisors: N. K. Nichols, S. L. Dance, A. S. Lawless, S. P. Ballard Sponsored by NERC and CASE studentship with the Met Office
Contents • A brief introduction to Data Assimilation • High resolution models • The “long wave” problem • A few numerical results • Conclusions
What is data assimilation? In order to run a weather forecasting model we need initial conditions. We want initial conditions which most accurately describe the observed reality. Data Assimilation allows us to combine observational data with a previous model forecast (background). The initial conditions are known as the “analysis”.
4D-Var time constrained by the numerical model
High resolution models Pictures from BBC website Accurate forecasting of convective storms is important because these storms can lead to dangerous flooding events, such as the Boscastle flood in 2004.
Boscastle Flood: Comparison of 00 UTC 12, 4 and 1 km forecasts 12-18 from 00 UTC 1km 12-18 from 00 UTC 12km 12-18 from 00 UTC 4km Actual peak accumulations reached about 200 mm (gauge), 130 mm (2 km radar) Plots from the Met Office, slide provided by S. L. Dance
If we want a model with high resolution it can only have a limited domain size due to restrictions in computer power. • This can create some problems; • The “long wave problem”. • A limited area model (LAM) needs boundary conditions. Met Office HRTM domains
Some numerical results Model set up The 1D heat equation with homogeneous boundary conditions Discretisation where
The truth has twice the spatial resolution and 4 times the temporal resolution of the LAM Truth Parent model domain is [0,1] Boundary conditions provided by the parent model LAM buffer zone buffer zone the LAM starts at the first internal grid point of the parent model and covers exactly half of its domain the LAM has 4 times the spatial resolution and 16 times the temporal resolution of the parent model
Model set up The 1D heat equation with homogeneous boundary conditions Discretisation where Davies Relaxation scheme where b is the width of the buffer
Aim: To consider and compare the treatment in the parent model and the LAM of wavelengths which are • Shorter than the resolution of the parent model
where --- truth --- parent background __ parent analysis + observations Parent model outputs
where LAM domain --- truth --- parent analysis __ LAM analysis + observations LAM model outputs
The Discrete Fourier Transform of the function is __ LAM __ parent model __ truth Wavenumber k
Aim: To consider and compare the treatment in the parent model and the LAM of wavelengths which are • Shorter than the resolution of the parent model • Longer than the domain of the LAM
0 1 2 3 4 5 6 7 8 Wavenumber k __ LAM __ parent model __ truth
Summary The LAM can represent wavelengths that are missed by the parent model. However, the LAM may actually be worse at reproducing the longer wavelengths. When the wavelength is longer than the domain of the LAM it cannot be correctly reproduced.
Future Work The “long wave” information is important and the challenge is how to assimilate observations of these “long waves” in order to feed information from the large scales into the analysis for the limited area model. One option may be to split the scales. Take longer wavenumbers from the parent model and shorter wavenumbers from the LAM.
Plot taken from “Development of 1-4km Resolution Data Assimilation for Nowcasting at the Met Office”. S. Ballard, Z. Li, M. Dixon, S. Swarbrick, O. Stiller and H. Lean. WMO Nowcasting Meeting Abstract 3.02
where --- truth --- parent background __ parent analysis + observations Parent model outputs
where --- truth --- parent analysis __ LAM analysis + observations LAM model outputs