Download

1 / 7
70 likes | 172 Views
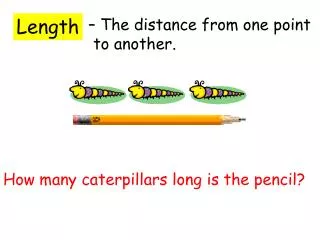
Applying Length. Unit of Study: Length in Customary Units Global Concept Guide: 3 of 3. Content Development. This GCG allows children to demonstrate their understanding of measurement and data. Students will solve real world problems and use line plots to represent measurement data.

E N D
Applying Length Unit of Study: Length in Customary Units Global Concept Guide: 3 of 3
Content Development • This GCG allows children to demonstrate their understanding of measurement and data. Students will solve real world problems and use line plots to represent measurement data. • A Line Plot is a graph that shows frequency of data along a number line. • To make a line plot, a number line is drawn and an X is made above the corresponding value on the line for every corresponding data element. One advantage of a line plot is that every piece of data is shown on the graph. It is also a very easy type of graph for students to make. It is essentially a bar graph with a potential bar for every possible value. (Van de Walle, 2006) • It is extremely important for students to understand that only NUMBERS go on the X-axis of the line plot.
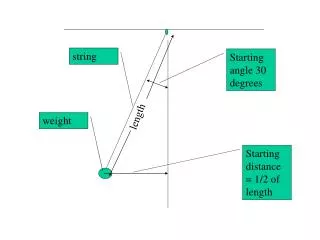
Day 1 • Essential Question:How can measurement tools help me solve problems involving lengths? • On Day 1, students will use open number lines, bar models and diagrams to solve problems. Number lines and the bar model are consistently an area where Hillsborough County students require additional practice. Some students may be able to solve the problem without the number line or bar model, but teachers should encourage students to relate their thinking to the number line or bar model. This will improve students’ understanding of number lines and bar models which they will apply in future learning as content increases in complexity. • Example Engage: Shanna and Lesley were comparing the lengths of their dogs. Dakota is 24 inches long and Riley is 9 inches shorter than Dakota. How long is Riley? • Students will solve real world problems involving measurement situations. Students can apply their understanding with the following tasks: • Problem Solving Measurement • Problem Solving • By the end of Day 1, students will be able to solve real world problems involving measurement.
Day 2 • Essential Question: How do you undersand and create a line plot? • The focus of Day 2 is to introduce students to the line plot, teach them to intrepret data represented on a line plot and use measurement data to create a line plot. • Line plots only display numerical data. Examples include: Age, height, money earned, shoe size etc. Line plots do NOT display categorical data such as: kinds of pets, movie types, foods, names, etc. • Children learn about the different parts of a line plot, including a title, labels and symbols. The title can be at the top or bottom of the line plot. Students need to represent all numbers in the numerical range on the bottom of the line plot. For example if they have the following set of data: 5, 6, 7,7,9, students still need to represent the value 8 on the plot. Students should be taught to organize the data prior to creating the line plot and data should be represented from least to greatest. Symbol Labels Title
Day 2 continued • Students can apply their understanding of a line plot by analyzing the following: • The following questions can be used to help students build their understanding of how to read and intrepret line plots. • How many students studied for 40 minutes? • How many students studied more than 50 minutes but less than 70 minutes? • What was the most common amount study time? • How many students studied? • Students can practice intrepreting and creating line plots with the following task: Line Plots. • By the end of Day 2, students will be able to create a set of measurement data, organize the data and create a line plot based on the data. Students will also be able to answer questtions based on the data.
Day 3 • Essential Question: How can a line plot be used to show measurement data? • On Day 2, students analyzed and created various line plots. Students will continue furthering their understanding of line plots on Day 3 as they measure a set of objects and create a line plot based on the measurements. • Have students complete the following task: Line Plots • As students collect their data, encourage them to organize it from least to greatest. • Have students determine the scale for their line plot. • Have students plot their data on the line plot. • Facilitate discussion about the data on the line plot. • Go Math Lesson 8.9 allows students additional opportunities to create line plots based on sets of data. • By the end of Day 3, students will be able to measure a set of objects, create a line plot based on the measurements and answer questions based on the set of data represented on the line plot.
Reteach • RtI Tier 2 TE pg. 421 B • Use 8.5 Reteach p R81 as a guide to create additional questions for small groups • Animated Go Math: Line Plots • Enrich • Enrich 8.5 – Pg. E81 • In pairs, have students create their own set of data, create a line plot for the set of data and create questions based on that set of data. Have students swap with a partner to answer the questions. • Students can also complete the following task: Identify the Error Enrich/Reteach/Intervention