Download
1 / 1
10 likes | 131 Views
Using the MJO to make Statistical Predictions of Weekly TC Activity in the Southern Hemisphere *. Anne Leroy M é t é o France, Noum é a, Nouvelle-Cal é donie. Matthew C. Wheeler Bureau of Meteorology Research Centre, Melbourne, Australia. 1. Introduction

E N D
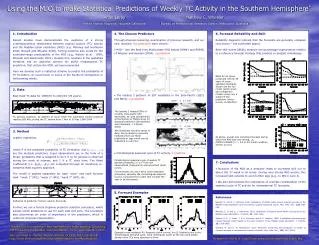
Using the MJO to make Statistical Predictions of Weekly TC Activity in the Southern Hemisphere* Anne Leroy Météo France, Nouméa, Nouvelle-Calédonie Matthew C. Wheeler Bureau of Meteorology Research Centre, Melbourne, Australia 1. Introduction Recent studies have demonstrated the existence of a strong contemporaneous relationship between tropical cyclone (TC) activity and the Madden-Julian oscillation (MJO) (e.g. Maloney and Hartmann 2000; Bessafi and Wheeler 2006). Strong evidence also exists for the extended-range predictability of the MJO (e.g., Waliser et al . 1999; Wheeler and Weickmann 2001). Despite this, nowhere in the published literature has an objective scheme for skilful intraseasonal TC prediction, that utilizes the MJO, yet been presented. Here we develop such a statistical scheme to predict the probability of TC formation (or occurrence) in zones of the Southern Hemisphere in forthcoming weeks. • 4. The Chosen Predictors • Through physical reasoning, examination of previous research, and our own analysis, five predictors were chosen: • MJO – Use the Real-time Multivariate MJO indices (RMM1 and RMM2) of Wheeler and Hendon (2004). 2 predictors • The leading 2 patterns of SST variability in the Indo-Pacific (SST1 and SST2). 2 predictors • Climatological seasonal cycle of TC activity. 1 predictor 6. Forecast Reliability and Skill Reliability diagrams indicate that the forecasts are generally unbiased (not shown – see submitted paper). Brier skill scores (BSSs) measure the percentage improvement relative to a reference forecast strategy that predicts a constant climatology. BSSs for all zones computed with all 35 years of cross-validated hindcasts. Shown are the full model (solid curve), and comparison models using only a subset of the predictors (other curves, as labelled). 2. Data Best track TC data for 1969/70 to 2003/04 (35 years). The leading 2 rotated EOFs of monthly Indo-Pacific SST anomalies, as used operationally at the Bureau of Meteorology for seasonal prediction (Drosdowsky and Chambers, J. Climate, 2001). We interpolate monthly values to daily, being careful to generate hindcasts that use these predictors at lags which can be replicated in real time. TC genesis locations, as defined to occur when the estimated central pressure reaches 995 hPa, during the TC season from 1 Nov to 30 Apr, 1969-2004. 3. Method Logistic regression: where P is the predicted probability of TC formation, and (x1,x2,x3,….,xm) are the multiple predictors. Input observations are in the form of a binary probability that is assigned to be 0 if no TC genesis is observed during the week of interest, and 1 if a TC does form. The fitted coefficients (i.e. β0,β1,…,βm) are computed through an iteratively re-weighted least squares approach. The model is applied separately for each “zone” and each forecast lead: “week 1” (W1), “week 2” (W2), “week 3” (W3), etc.. Further, we use a formal stepwise predictor selection procedure, which selects which predictors to use for each lead and zone. The procedure also determines an order of importance of the predictors, which is useful for physical interpretation. As above, except only including forecasts during which the MJO was very strong, i.e. (RMM12+RMM22)1/2 > 2.0 in the initial condition, and for z3 only. ˆ Climatological seasonal cycle of weekly TC genesis probability in “z3” from raw observations (histograms) and smoothed (solid curve). For hindcasts, we use a strict cross-validation procedure, whereby the climatological seasonal cycle is computed from years that exclude the year to be forecasted. • 7. Conclusions • Inclusion of the MJO as a predictor leads to increased skill out to about the 3rd week in all zones. During very strong MJO events, this increased skill extends to even further lags (e.g., to W6 in zone 3). • We also demonstrate the importance of a simple consideration of the seasonal cycle of TC activity for intraseasonal TC forecasts. 5. Forecast Examples References Bessafi, M. and M. C. Wheeler, 2006: Modulation of South Indian Ocean tropical cyclones by the Madden-Julian Oscillation and convectively coupled equatorial waves. Mon. Wea. Rev., 134, 638-656. Maloney, E. D. and D. L. Hartmann, 2000: Modulation of Eastern North Pacific hurricanes by the Madden-Julian Oscillation. J. Climate, 13, 1451-1460. Waliser, D. E., C. Jones, J. K. E. Schemm, and N. E. Graham, 1999: A statistical extended-range tropical forecast model based on the slow evolution of the Madden-Julian Oscillation. J. Climate, 12, 1918-1939. Wheeler, M. and K. M. Weickmann, 2001: Real-time monitoring and prediction of modes of coherent synoptic to intraseasonal tropical variability. Mon. Wea. Rev.,129, 2677-2694. Definition of prediction “zones” used in this study. * Prepared for the workshop “New Approaches to Understanding, Simulating, and Forecasting the Madden-Julian Oscillation”, Irvine, California, Nov 2007. Also submitted to Monthly Weather Review, October, 2007. Full text at http://www.bom.gov.au/bmrc/clfor/cfstaff/matw/cv.html#publications Example cross-validated W1 forecasts (solid curves) for z3. Dashed curve is the climatological seasonal cycle. Solid rectangular boxes at the top mark weeks during which TCs were observed to form. Forecasts on WWW at http://www.meteo.nc/espro/previcycl/cyclA.php