Download

1 / 42
440 likes | 574 Views
What Is Your Climate Classification?. Lynne Hehr, Director, STEM Center for Math and Science Education and Arkansas NASA Resource Center, University of Arkansas lhehr@uark.edu John Hehr, Professor, Department of Geosciences, University of Arkansas jghehr@uark.edu

E N D
What Is Your Climate Classification? Lynne Hehr, Director, STEM Center for Math and Science Education and Arkansas NASA Resource Center, University of Arkansas lhehr@uark.edu John Hehr, Professor, Department of Geosciences, University of Arkansas jghehr@uark.edu http://cmase.uark.edu > Lynne’s Wiki
Objectives • become familiar with the Köppen-Geiger Climate Classification system • understand that climates can be broadly classified using a system based on specific variables: air temperature and precipitation.
calculate simple statistics and analyze a long-term (30 year) temperature and precipitation dataset • explore the relationship between temperature and precipitation to determine the climate classification for their location
Climate • average of the day-to-day weather over a long duration • generally refers to 30 years or more • temperature and precipitation are extremely important
Climate Classification • provides understanding that temperature and precipitation are both important to climate • developed by WladimirKöppen (1918) for world climate types using annual and seasonal patterns of temperature and precipitation as well as vegetation types • updated in 1954 by Rudolf Geiger making it available as a world map • is widely used today and known as the Köppen- Geiger Climate Classification system • identifies 31 different climatic regions
5 major climate types • Equatorial (A) • Arid (B) • Warm Temperate (C) • Snow (D) • Polar (E) Each climate type can be further classified by precipitation and temperature conditions, resulting in in 31 different climate classifications.
Activity 1: Climate Classification Categories 5 major climate types: A, B, C, D and E
Task 1:Classify each city into one of the 5 major climate types Use the World Map as reference.
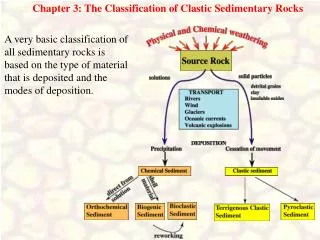
Figure 1. Map of India, showing the location of New Delhi (Source: worldtravels.com)
Activity 1: Classification Calculations will be made based on long-term (30 Year) data from New Delhi, Delhi, India. Task 2: • Calculate the annual temperature (Tann) by adding up the monthly mean temperature values and dividing by 12 (months in a year). Put this answer in Table 2A. Task 3: • Record the coldest month’s temperature (Tmin) and the warmest month’s temperature (Tmax) in Table 2A. Task 4: • Add up the monthly mean precipitation values to find the accumulated annual precipitation (Pann). Task 5: • Using either Table 1 or the Climograph in Figure 2, determine when precipitation falls and calculate the Precipitation Threshold (Pth). Complete Table 2A. The Precipitation Threshold (Pth) • determines the relationship between precipitation and evaporation • also known as the dryness index and is dependent upon when precipitation falls during the year.
Determine the major climate classification for New Delhi, India Use the Koppen-Geiger Climate Classification key Tann Annual Air Temperature (°C) ? Tmin Air Temperature of Coldest Month (°C) ? Tmax Air Temperature of Warmest Month (°C) ? Pann Accumulated Annual Precipitation (mm) ?Pth Precipitation Threshold (mm) ?
Task 6:Determine the major climate classification Using Part 1 of the Köppen-Geiger Climate Classification key determine the major climate classification – Equatorial (A) Arid (B) Warm Temperate (C) Snow (D) or Polar (E) New Delhi’s Main Climate Type is:
How to determine the sub-climate classification Step 2: 2nd letter : sub-classification uses the relationship between when precipitation falls and how much precipitation falls is important. (Use the classification key) 3rd letter: Some climate zones have a third sub-classification based on temperature.
Task 7: Study the data and complete the following: TminPrecipitation in the driest month (mm) TwmaxPrecipitation in the wettest winter* month (mm) TwminPrecipitation in the driest winter* month (mm) PsmaxPrecipitation in the wettest summer* month (mm) Psmin Precipitation in the driest summer* month (mm) Are there at least 4 months with Air Temperature greater than 10° C (yes/no) Note: Winter and Summer are defined as half-years within this classification system. Therefore, winter is considered to be “low-sun” months (November through March in the Northern Hemisphere, or April through September in the Southern Hemisphere) and summer is considered to be “high-sun“ months (April through September in the Northern Hemisphere, or October through March in the Southern Hemisphere)
Task 8: In the Arid (B) section determine the 2nd sub-category and the 3rd sub-category • New Delhi’s main climate type is: • New Delhi’s first sub-climate classification is: • Second sub-climate classification is: • Köppen-Geiger classification is:
Step 4: Sum up How did the calculated classification compare to your original predictions for New Delhi?
Activity 2: Practicing Climate Classification Skills Step 1: (Using 30 year NCDC World Map) Task 1: Using the city data provided, produce a climograph of monthly mean air temperature and precipitation. Task 2: Discuss the description of the climate of this location.? Task 3: Classify the climate of the location.
Go to Polar Go to Arid Go to Equatorial Go to Warm Temperate Go to Snow Skip to descriptions
Back Go to 5
Back Back
Back Go to 5