Download
1 / 12
150 likes | 385 Views
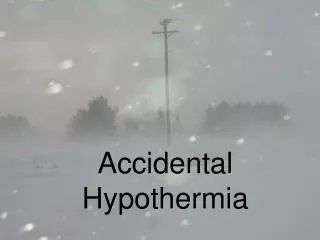
Accidental Coincidences. Learning Objectives. Understand the difference between real and accidental coincidences in an experiment using 2 scintillators Understand the relevance of accidental coincidences in CROP experiments Learn how to evaluate the contribution of accidental

E N D
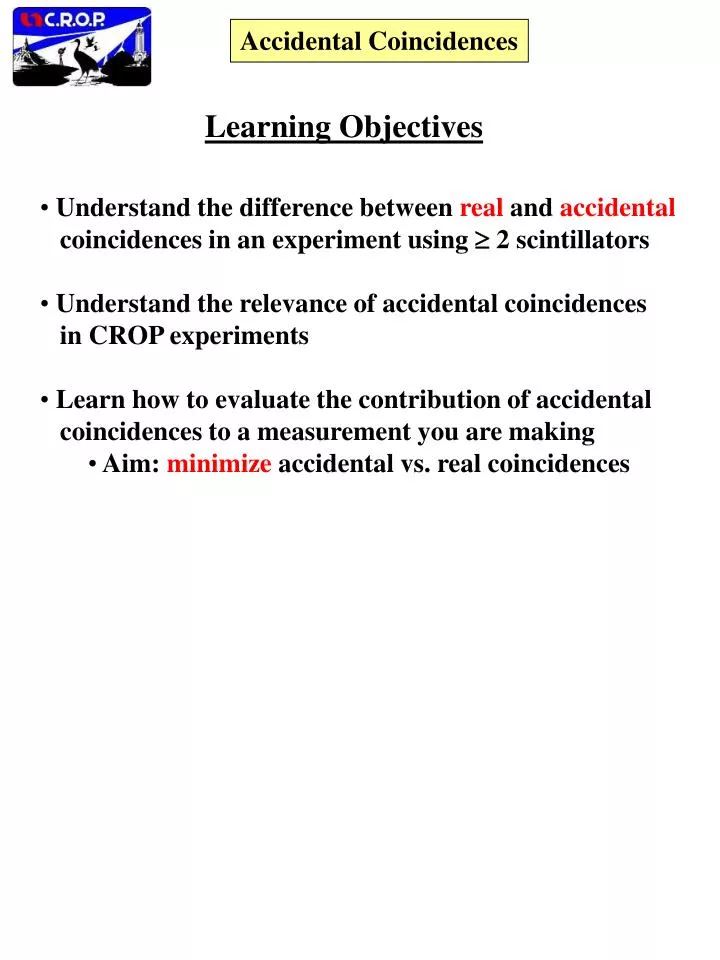
Accidental Coincidences Learning Objectives • Understand the difference between real and accidental • coincidences in an experiment using 2 scintillators • Understand the relevance of accidental coincidences • in CROP experiments • Learn how to evaluate the contribution of accidental • coincidences to a measurement you are making • Aim: minimize accidental vs. real coincidences
Accidental Coincidences Outline • Coincidence counting in CROP experiments • Typical coincidence circuit set-up • Mt. Michael Benedictine High School experience • A careful look at accidental coincidence rates • Formula for estimating accidental rate • Quantitative discussion of Mt. Michael observation • Power of adding 3rd, 4th detector in coincidence • decision
3 2 1 1 1 2 2 3 3 Accidental Coincidences We will be dealing with coincidences among CROP detectors in almost all measurements. Mini-experiments during the first academic year Vertical telescope 1. Cosmic-ray rate (coincidences per second) vs. barometric pressure • 2. Coincidence rate • vs. detector separation • Extensive air showers • Optimization of detector • geometry on rooftops Detectors spread horizontally
Accidental Coincidences Typical coincidence circuit set-up Logic pulse Digital, i.e. on or off Det1 Analog signals Det2 Coincidence unit Logic unit Discriminator • Logic unit fires when it receives overlapping “on” signals • from Det1 and Det2. Det1 Det2 Two overlapping “on” signals • Coincidences come from: • Real cosmic rays traversing both detectors. • Accidental overlap of random triggers in Det1 and Det2. • Cosmic rays hitting only one detector. • Electronic noise. • Each detector has its own “singles rate” which will determine • the rate of accidental coincidences.
Accidental Coincidences Mt. Michael Benedictine High School Experience • CROP 2000 first-year participating school • Mini-experiment • Coincidence rate vs. horizontal separation • Two detectors only • Report at April 2001 CROP meeting at UNL • Note constant rate for separation > 5 meters • 25 coincidences / 10 minutes • 0.04 coincidences / second • Real or accidental?
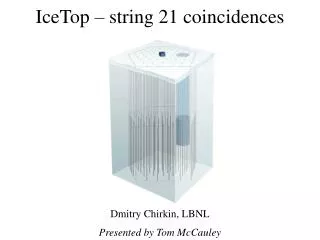
Accidental Coincidences Mt. Michael Benedictine High School Experience
Accidental Coincidences Vertical scale: linear Discriminator threshold scans for 3 detectors Vertical scale: log
Accidental Coincidences Mt. Michael Benedictine High School Experience Data from experiment: 2-fold coincidence rate vs. detector separation in meters
Accidental Coincidences A simple, specific example Det1 and Det2 logic pulses from discriminator 100 nsec • Assume Det1 and Det2 fire their discriminators at random times • (4 counts/second) and that the discriminator output widths • are 100 nsec. • For a typical second, the random firings can happen anytime • within that 1 second period. 1 second Det 1 discriminator output 100 nsec width Det 2 discriminator output How often, on average, do the Det1 and Det2 signals happen to overlap?
If any Det2 pulse comes within a 2 100 nsec = 200 nsec window of any Det1 pulse, the coincidence unit will fire. Estimate of accidental coincidence rate: S1 S2 t Det1 singles rate Det2 singles rate Logic pulse width 4 counts/sec 4 counts/sec (2 100 nsec) = 3.2 10-6 per second General formula: Accidental coincidence rate = S1 S2 (2 t) (coincidences/second) !! Formula assumes the two logic pulses have the same width and that the coincidence unit requires minimal overlap to fire!! Accidental Coincidences Close-up view Det1 100 nsec Det2 200 nsec
Accidental Coincidences • Confirm that Mt. Michael’s coincidence rate for • separations greater than 5 m is consistent with • accidental coincidences. • Discuss the power of adding a 3rd and 4th • detector in the coincidence decision to • drastically reduce accidental coincidence rate.
Accidental Coincidences Counts per 5 minutes • Approximately 50 mV threshold chosen for A and B • Detector B singles rate = S1 = 80,000/5 min = 267/sec • Detector A singles rate = S2 = 110,000/5min = 366/sec • Predicted accidental coincidence rate: • S1 S2 (2 t) = 267/sec 366/sec 2 10-7sec • = 0.02 / sec accidentals • Observed: 0.04 / sec observed coincidence rate • We may conclude that all or most of observed coincidences • are due to accidentals!! 100 nsec