Download
1 / 80
810 likes | 974 Views
Application of Physical Geography. Part four: Application of Physical Geography — Method 、 principles and scheme. Chapter 14 Evaluation and zoning of the Earth ’ s Surface Environment Chapter 15 Prediction of the Earth ’ s Surface Environment

E N D
Application of Physical Geography
Part four: Application of Physical Geography —Method、principles and scheme • Chapter 14 Evaluation and zoning of the Earth’s Surface Environment • Chapter 15 Prediction of the Earth’s Surface Environment • Chapter 16 Planning and Management of the Earth’s Surface • Chapter 17 Adjustment of the Earth’s Surface System
Chapter 14 Evaluation and zoning of the Earth’s Surface Environment Climate classification and evaluation of climate environment Regionalization and evaluation of biological environment Evaluation and zoning of topography, landform and geological environment Distribution and evaluation of water resources Land classification,land gradation and land evaluation Integrated physicogeographical regionalization
Climatic patterns climate belts Climatic patterns climate belts Tropical climates Tundra Tropical rainforest climate polar Tropical monsoon climate Icecap Tropical savanna climate Steppe Mediterranean climate Humid mesothermal climates dry Climates Desert Dry winter subtropical Arid humid climate with no dry season Humid microthermal climates Humid subtropical highlands Subtropical monsoon KÖppen climate system and major climate belts and climatic types A、C、D、E are wet climate,B is dry climate,H is highland climate。Each climate is defined according to assigned values of temperature,precipitation and distribution of nature vegetable,Using f、m、w et al behind the first letter. Af for exampleshows tropical rainforest climate。Based on climate types, Each vice-climatic type is made off according to variables of temperature,using the third letter a、b、c、d et al. Cfa for example is humid subtropical。
Global six climatic belts( KÖppen climatic systems ) Based primarily on temperature and precipitation ,using vegetation patterns as a general indicator, W.Köppen, Germanic climatology established Köppen climatic system.It also dependson experience.However, such a classification system is yet to be development,and now it is widely accepted. The earth’s climates are viewed under the Köppen system as within global climates of six major climate belts labeled A,B,C,D,E and H as the first letter.
Climatic types(considering Desheng Liu) Wet equatorial climate Wet-dry tropical climate Tropical maritime climate Tropical arid-semiarid climate Tropical monsoon climate Subtropical dry climate in summer Moist subtropical climate Subtropical monsoon climate Subtropical continental arid-semiarid climate Sub-frigid continental climate Pole long-cold climate Pole ice-field climate Highland climate Temperature maritime climate Temperature moist continental climate Temperature monsoon climate Temperature continental arid-semiarid climate
Impact of climate on human • Direct impact of master meteorological elements on human physiology:oxygen:Human being can suffer from oxygenous pressure reducing 20%. Generally speaking, people will have alpine reaction at an altitude of 2000 m; temperature:Generally human body only stand ±4oC variety inside the body. If temperature was under 32oC ,people would lose consciousness. If temperature was over 41oC circle system of human body is likely to breakdown. Hot-wet synthetic influence : temperature between 20 and 24oC,humidity between 40% and 60% are most comfortable to people。 • Indirect impact of master meteorological elements on human physiology (In different climatic areas and different seasons,there were different typical diseases,and incidence of a disease is unlikeness。Incidence of rheumatism and arthritic is four times in cold-humid area than in dry-hot area) • Climate and meteorological disaster(In different climatic areas, there were different climate and meteorological disasters,which had an impact on human life and produce)
Sense classification of human towards temperature and humidity Temperature between 20 and 24oC,humidity between 40% and 60% are most comfortable to people. When environment was torridity and wateriness ,people would feel uncomfortable. index THI denotes combination of temperature and humidity. sense Most people feel comfortable At least half people feel uncomfortable Nearly all people feel uncomfortable
Evaluation index of biological environment Evaluation index of biological environment: 1、biodiversity 2、net primary productivity
Biological function in the forming of earth’s surface environment Changing components of atmosphere and hydrosphere Attaching to the movement of earth’s chemistry elementary Biological function in the forming of earth’s surface environment Participating in construct of rock and nonmetallic mineral Participating in petrous effloresce and edaphic forming
Net primary productivity of Global continent(Huggett,1998) From net primary productivity of Global continent and ocean,we can easily see , land’snet primary productivity is higher than oceanic, shallow sea’s alongshore higher than widen ocean,forest’s higher than grassland’s,swamp’s higher than river’s and lake’s,grassland’s higher than desert’s ,and so on. dm2 refers to dry substance
Mediterranean vegetation Highland vegetation Tropical deciduous forest Tundra Temperature north coniferous forest Temperature coniferous forest Temperature deciduous forest Grassland Desert Savanna/ woodland Tropical rainforest Global land community (Mackenzie,1998)
Evaluation and regionalization of Topography、relief and geological environment evaluating processes of terrain, relief and geologic environment height above sea level:The higher of height above sea level, the littler of biologic production, population and economic consistency. surface constitute:from the height of surface compositive content of element,evaluating elemental geochemistry environment,elemental geochemical environment carves up good, common and bad. geological hazards:as the example earthquake, volcano, coast, landslip, and so on,severely threaten human living and procreative conditions。 terrain undulation:the more surface relief is,the more discommodiousness human living is. According surface relief,suitability was divided into:suitability less than 100 m,common between 100 and 500 m,unsuitability between 500 and 1000 m,very unsuitability above 1000 m. morphologic sections:different sections have different conditions.
altitude (m) classification amenity unsuitability to many people litter suitability common suitability the best influencing classification of altitude impacting on human living From current status,not only productivities,hut also population density,will minish with altitude increasing. So we can say that,under the current conditions of science and technology and economy,to many people,high altitude is not suitability to people’s life and residence. If want to classify altitude, you can reference the classified standard of mountain and knap. Classification of suitability to people living according to altitude(Wang jian,2000)
Content of necessary elements absorbed by human body content of poisonous elements absorbed by human of biology element geochemical environment of human nothing good moderate existence normal moderate nothing normal less or more existence less or more bad constitution of surface elements and human geochemical environment ( Jian Wang,2000) There are a lot of elements in the earth’s surface. According to the relationship between elements and human body、biology ,they are separate into necessary elements,unnecessary elements and poisonous elements. Because in different place there are various elements ,elements distribute imbalance in different areas, and impact on people’s health. If evaluating surface substantial composing in some place in regard to advantages or disadvantages,seemliness and unseemliness of human circumstance,you should think of elementary content and advantages and disadvantages.
classification Surface relief (m) suitability amenity normal unsuitability very unsuitability classification and impact on human life of terrain undulation Surface undulation have an important effect on human living and production. To most people,life more facilitate in plain than in rugged areas。Using standard margin of altitude,in a certain extent can show the degree of surface undulation,it can be named relief。According to relief,you can evaluate environmental amenity. Surface relief and suitability of human life(Wang jian,2000)
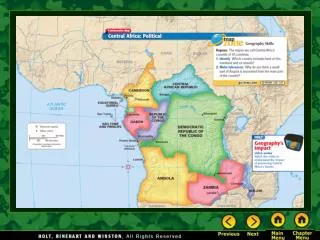
Characters of Chinese landform、relief and geological environment Three ladders;Chinese terrain is high in the west and low in the east,and lowers along Tibetan plateau . Three across three vertical and a arc characteristic of mountain system—framework of Chinese surface structure four plateaus、four basins and three plains four plateaus:Tibetan plateau、inner Mongulian Plateau、Loess plateau and Yunnan-Guizhou Plateau; four basins:Tarim Basin、Juaggar Basin、Chaidamu basin 、Sichuan basin; three plains:Northeast plain、the north china plain and the middle and lower Valley of Yangtze River
The first ladder The second ladder The third ladder Three ladders China’s terrain is high in the west but low in the east sloping from Tibetan Plateau toward east. Three ladders are the true portray of China’s terrain. Tibetan Plateau lies on the first ladder which is also the highest ladder, with the average elevation between 4,000 meters and 5,000 meters. The north and east of it are surrounded by a series of basins and plateaus, with the average elevation between 1,000 meters and 2,000 meters. The eastern part of line of Daxing’ anling Mountain-Taihang Mountain-Wushan Mountain-Xuefeng Mountain is the third ladder of China. 500 meters above sea level, it is mainly composed of low mountains, hills and plains. As a result, most of rivers of China flow from west to east, such as Yangtze River、Huanghe River、Pearl River、Huai River、Haihe River and so on.
The Characteristics and Spatial Distributions of Water Resource The characteristic of complex change The characteristics of water resource The characteristic of circulate supply The characteristic of being used comprehensively The characteristic of indispensable The characteristic of duality Spatial distributions of water resource The total volume of water on the earth is about 1.36×10¹⁰ km3. But most of it is ocean water which covers 97.22 percent of the total and fresh water only accounts for 2.78 percent of the total. Furthermore, ice accounts for 77.14 percent of fresh water and the volume of river water that can be utilized directly by human beings is 1,250 km3 accounting for 0.003 percent of the total. As far as fresh water that can be utilized by human beings is concerned, the volume per capita is 5×10⁶ litre which can meet the need of human beings. But the problem is not that there is not enough water but that water resources distribute unevenly. As a result, there is crisis of water in some places but flood in other places. More seriously, in some places, there are duality crises unfortunately.
Evaluation on Water Resource Evaluation on water resource refers to the comprehensive evaluation on the quantity, quality, space-time distribution of water resource in a area. Making a scientific evaluation on the water resource is the precise of exploiting and utilizing water resource reasonably and is also the scientific basis of programming, regulating and protecting water resource. Source and distribution Contents of Evaluation on water resource Provision and supply Change Water quality Principle of taking the quantity and quality of water resource into account at the same time Principles of evaluation on water resource Principle of exploiting and utilizing water resource synthetically Principle of investing, exploiting and regulating water resource harmonically Principle of mutual transformation between surface water, ground water and atmosphere water
Total volume 100% The ratio of fresh water volume to the total 2.78% The ratio of surface water volume to the total 0.643% Snow and glacier 99.35% Ocean water Fresh lake 0.33% Fresh water Saline lake 0.28% 2.78% Atmosphere Water 0.03% Soil water Deep ground water 11.12% Ground water 11.02% Glacier 0.003% Formation of the Hydrosphere Each kind of water body interrelates with each other through water cycle so as to form a whole hydrosphere. In a broad sense, all the water that is useful for human beings directly or indirectly can be included in water resource. As far as capacity of current technology and economy is concerned, ocean water, groundwater buried deeply and glaciers distributing on the polar, high mountains and plateaus can not be exploited and utilized on a large scale. Therefore, water resource is commonly known as surface freshwater resource that can be utilized directly by human beings and ground freshwater resource buried not deeply. But this volume is less than 0.01 percent of the total water storage of the world. Fresh water
Map of Global River Annual Runoff (Jones,1998)
Land area Annual average Runoff (km3/a) The proportion to global annual runoff (%) The proportion to global population in 2010(%) Estimated population of 2010(Ma) Time of population doubling (a) Region Africa Asia Australia- Oceania Europe North America South America Global The Contrast among Potential Water Supply、 Estimated Population of 2010 and Time of Population Doubling of Each Continent • With the increasing of population, water supply per capita is decreasing. On the other hand ,with the development of economy, water requirements per capita is increasing at the same time. It is estimated that there should be about eighty countries lacking in water in the coming future.
Names of runoff area Precipitation (mm) Runoff depth (mm) Land Evaporation (mm) Runoff Coefficient (%) Natural landscape Areas lacking in water Desert Areas with little water Semi-desert and prairie Deciduous broadleaf forest and forest prairie Transition area Evergreen and deciduous Broadleaf forest Areas with much water Tropical rainforest and Sub-tropical evergreen forest Areas rich in water Division of Earth’s Surface Runoff Resource in China The runoff of China is supplied by precipitation. As a result, it distributes corresponding to precipitation. On the basis of runoff quantity, precipitation and evaporation, China was divided into five different areas: areas rich in water, areas with much water, transition areas, areas with little water and areas lacking in water.
Outlines of Land Classification and Land Evaluation Land adaptability refers to the land suitable degree to some kind of economic utility. Mutisuitability: Lands are suitable for agricultural production, forest production and pasture production at the same time. Doblesuitability: Lands are suitable for two types of production mentioned above at the same time. Singlesuitability: Lands are suitable for one type of production mentioned above. Nosuitability: Lands can not be utilized with current science and technology. Limitation: It refers to the restraining degree of some adverse factors to land suitability and productive potential. Economic benefits: It refers to the available benefits provided by land. It is one of the main measurements of land quality. Ecological benefits: It refers to the quality of land ecosystems.
The Comparison Among Land Classification Units(Chen Chuan-kang, 1993) Three levels of classification system Phase: It is the minimal unit of land classification and also the land region where the comprehensive natural characteristics are most consistent. Land facet (land unit): Phases combine with each other regularly so as to form the intermediate land classification unit. District (land system): Land facets combine with each other regularly so as to form the advanced land classification unit. From phase to land facet and further to district, the inner structures of land become more and more complex, the inner consistency is weaker and weaker but the discrimination gets more and more obvious.
Of state Family Specie Genus State Units of physical regionalization Of landscape Family Sequence of individual unit Genus Landscape Specie Of district Genus Specie Family District Of land facet Genus Family Units of land classification Specie Land facet Genus Family Of phase Specie Phase Sequence of characteristic unit The Relationship Between Individual Unit and Grade Generally, family, genus and specie can be used as units of land type by virtue of biologic classification. For example, as far as the division of land type in the same level is concerned, the phases with similar property are included into phase specie, the phase species with similar property are included into phase genus and the phase genus with similar property are included into phase family. In a similar way, the land facets with similar property are included into land-facet specie, the land-facet species with similar property are included into land-facet genus and the land-facet genus with similar property are included into land-facet family. According to the same method, district can be divided into district species, district genus and district family. 据伊萨钦科
Characteristics of soil and vegetation (wet→dry) (high→low) Physiognomy site According to Chen Chuan-kang Double-Row Index Grid Method After classified, the land grade can be noted by the method of sequence. That is to say, all levels of units can be showed directly in sequence of family, genus and species. Generally, family can be noted by Latin numbers, such as Ⅰ,Ⅱ,Ⅲ,Ⅳ,Ⅴ and so on. Genus can be noted by English letters, such as a, b, c, d, e and so on. Species can be noted by Arabian numbers, such as 1, 2, 3, 4, and so on. Finally , three of them are assembled orderly so as to express land grade and their relations with signs, such as Ⅰa1、Ⅱb2、Ⅲc3. At the same time, it also can be expressed by double-row index grid method.
Decreasing adaptability Adaptability Potential Muti- adaptability Double- adaptability Single- adaptability Noadaptability Grade Suit for agriculture and pasture Suit for forest Suit for pasture Suit for none The best The better Good Common Decreasing productive potentials Chart of Land Grade Land grade is the final result of land assessment and also the essential part of land grading. The number of land grade is ascertained according to the complexity of assessment purpose. At present, land grade is classified into eight. From the first to the eighth, land adaptability and productive potentials decreases orderly but numbers of restrictive factors to them are more and more. If the they are in the same level of grade, then land adaptability and productive potentials of them are the same too.
Hillside, seacoast and valley Lake basin Recurrent-type structure (according to Chen Chuan-kang) Recurrent-Type Structure(According to Chen Chuan-kang) Land structure can be classified into two types: recurrent-type structure and repeated-type structure. Recurrent-type structure means that each kind of land type arranges in spatial sequence and combines together to form a certain sequence.
Paleo-hammocks on the plain Gulches on the mesa Repeated-type structure (according to Chen Chuan-kang) Repeated-Type Structure (According to Chen Chuan-kang) Repeated-type structure means that land type does not alternate in spatial sequence but distributes as patches. The typical examples are mesa incised by gulches, paleo-hammocks and grassland in the shallow valley.
Comprehensive Physical Regionalization Physical regionalization refers to research means by which physical regional units are classified and merged gradually according to comparability and difference of physical geographical characteristics in some certain areas and some regional hierarchical system are built based on the subordinations between these regional units. Principles of regionalization Methods of regionalization Principle of the same inducing reasons; Principle of homologous appearance; Principle of regional conjugation; Principle of combining comprehensive analysis with leading factors; Principle of combining zonal factors with unzonal factors. Methods of geographic relative analysis; Methods of prevailing symbols; Methods of from-top-to-bottom; Methods of from-bottom-to-top; Methods of overlap of departmantal Regionalization.
Belt Zone Big region Country Section Zone Region Province Sub-zone Sub-region Sub- section State State Hypo- section Hypo-zone Area Double-row Hierarchical System and the Relationships among Its Units Nature regions are restricted jointly by laws of zonal distributions and unzonal distributions. Based on this two differential laws, land regionalization was classified into zonal regionalization unit hierarchical system and unzonal one. The both are jointly entitled as double-row hierarchical system of comprehensive physical regionalization unit. As for zonal hierarchical system of regionalization unit, it follows the sequence: natural belt, natural zone, natural sub-zone and natural hypo-zone. As far as unzonal one is concerned, it follows the sequence: big region, natural region, sub-region and small region.
①Boundary of big regions ② Boundary of regions ③ Boundary of sub-regions ④ Boundary of hypo-regions ⒈ Boundary of belts ⒉ Boundary of zones ⒊ Boundary of sub-zones ⒋ Boundary of hypo-zones Zone Section Country Sub-section Hypo-section Province state Landscape Chart of Division of Single-row Hierarchical System(Modified by Chen Chuan-kang) From the point of some scholars, the differences between natural regions and laws of spatial distributions of regional units are the comprehensive reflections on laws of regional differentiation. As a result, it is suggested that there should be another uniform regionalization hierarchical system reflecting zonal and unzonal laws of regional differentiation and this system should follow the sequence : zone, natural country, section, natural province, sub-section, natural state, hypo-section, landscape and so on.
Comprehensive Physical Regionalization World’s physical regionalization The polar Cold temperate zone Warm temperate zone Five zones and one region Tibetan alpine region Tropical zone The equator Northwest arid region China’s physical regionalization East monsoon region Tibetan High- cold region Three large regions
The Characteristics of Three Big Regions (According to Xi Cheng-pan and Qiu Bao-jian)
Chapter 7 Predictions on the Earth’s Surface Environment • Section 1: Principles of predictions on the earth’s surface environment; • Section 2: The variation trend of the lithosphere; • Section 3: The variation trend of the atmosphere; • Section 4: The variation trend of the hydrosphere; • Section 5: The variation trend of the biosphere; • Section 6: The variation trend the earth’s surface environment.
Principles of Predictions on the Earth’s Surface Environment Principle of space-time scale Space-time scale must be taken into account when predicting the earth’s surface environment. Principle of mutual effects between human beings and nature We have to consider feedback of natural changes and human activities at the same time. Principle of relevance The earth’s surface environment is a complex system. Each subsystem interacts and interrelates with each other. Changes of subsystem will result in the changes of system. Non-linear principle When predicting the changes of environment,the first analysis we should make is the time limitation of prediction , what kind of state environment is in,whether or not it can be predicted and whether there are mutation spots during the limited time. With these, we can establish mathematics model for prediction.
The Variation Trends of the Lithosphere The result of Plate movement . Global continental Plate drifts westward:The longitude of ocean and continent will change; . Eurasian Plate and North America Plate move in opposite directions:It will result in gradual shrink of Pacific ocean and gradual expand of Atlantic ocean; .Australia Plate drifts northeastward: As a result, land area of southern hemisphere will decrease more and more; .India Plate drifts northward:Tibetan plateau and Himalayas will uplift further because of the obstruct of Eurasian Plate. The western part of China will drift northward. .East African Rift Valley enlarges:Red Sea will expand and turn into an ocean finally. Asia will separate from Africa。 There are a lot of human activities shaping the land. Reclamation, beach protection; Construction of irrigation facilities; City construction ; Different land use patterns.
Direction and Velocity of Plate Movement The direction and velocity of Plate movement won’t change a lot over decades to centuries. So is the boundary of Plate. Therefore, there won’t be essential changes to distributions of earthquake and volcano. That is to say, they still distributes on the edge of Plates especially concentrating on the circum-Pacific belt and Alpine-Himalayan orogenic belt. But as far as timescale of 1000000 years is concerned, there will be great changes to seismic belt, volcanic belt, distributions of Plates and land-sea profiles of the earth’s surface.
The Variation Trends of the Atmosphere The variation trends of the components of the atmosphere The amount of CO2,N2O,CH4 and haloid carbon in the air increases greatly but that of SO2 increases slightly. The amount of dust also changes. The variation trends of the structure of the atmosphere Formation of the Ozonosphere, depletion of the Ozonosphere and changes of the Ozonosphere. The variation trends of the atmosphere As far as timescale of 10000 years is concerned, modern interglacier epoch is about to be over and new glacier epoch is coming. It will become colder and colder. But because of greenhouse effect resulting from human beings, there will be a contrary trend of climatic change. As far as century timescale is concerned, it won’t be warmer than that of years between 1900 and 1950. But because of the impact imposed by human beings, greenhouse effect can not be controlled completely in a short time. Therefore, by taking account of natural factors and human disturbances, it will be warmer in 21st century than that of the 19th century but almost equal to or slightly warmer than that of 20th century.
The Variation Trends of Components of the Atmosphere (according to Machenzie) CO2 CH4 Concentration Concentration Concentration
Ultraviolet rays Formation of the ozonosphere Natural process Ultraviolet rays Ozone depletion Ozone depletion caused by Cl Human impacts Ozone depletion caused by NO Formation and depletion of the Ozonosphere
Temperature Greenland England global Tree-ring index Of Qilian Mountain Ice Land China (winter) Climatic Changes On a view of century timescale, the change of climate has the obvious characteristics of double-century period. The latest warm peak happened during the period of 1900-1950. There will be next warm peak after 2050. Therefore, it is relative cold during the period of 2000-2050. That is to say, it has been relatively warm-cool since 1950 and this trend will last till 2050. There will be a lot of short-time climatic fluctuations during this period, but as far as natural trend is concerned, it will not be warmer than that of 1900-1950.
Change Trend of the Hydrosphere Change of sea level The change of components and structures of the hydrosphere .Global warming——Glacier melting——Sea level rise; .Crustal subsidence——Relative rise of sea level; . Land subsidence——Sea level rise; .Temperature of sea water raising——Sea water expanding——Sea level rise. Water circulation and the change of water balance . Plate movement—Shrink of Pacific ocean and expand of Atlantic ocean— change of pattern of water circulation—Regional imbalance of water balance; .Further uplift of Tibetan Plateau——Desertification in the middle part of Asian; .Global warming——Great changes of global water balance. .The proportion of gaseous water and liquid water increases but that of solid water decreases; .Because of sea level rise, the earth surface’s water distributes toward low-latitude; .The trend of asymmetry distribution of river, lake and swamp becomes more and more obvious.
Sea Level Change It is indicated by research that current sea level is not horizontal but irregular. This surface varies with the change of earth’s gravity field. The highest uplift lies in New Guinea with an elevation 76 meters higher than mean sea level and the biggest depression lies in Maldives with an elevation 104 meters lower than mean sea level. The height difference between them is 180 meters and it surpasses the mean change range of sea level during glacier-interglacier epoches. Because the gravity field of earth surface is determined by the earth’s interior components and the lithosphere drifts eastward away from the centrosphere and mantle, the earth’s gravity field will change all over the world. It will result in the change of sea level.
Sea level changes High The change of aerosol since 1990 The amount of aerosol equal to that of 1990 Middle Low According to Warrick et al.,1996 Sea Level Change On a view of century timescale, there will be an ascend trend of sea level because of the global warming in the future. But as for the estimation to the increase range of sea level, there are great differences. According to the prediction on the trend of climate change mentioned above, we can conclude safely that mean sea level of the world will increase 15 centimeters by the year 2030 and increase 40-50 centimeters by the year 2100. But taking the factors like ground subsidence into account, the increase range of sea level on some large-scale eatuarine shorelines and coastal plains is far more than the value mentioned above. 据Warrick et al.,1996