Download
1 / 41
410 likes | 484 Views
Planning, preparing and thinking about level 2. WMA 21 November 2011. Introductions. Anne Lawrence Centre for Educational Development Massey University Palmerston North a.lawrence@massey.ac.nz. http://ced-mxteachers-news-site.wikispaces.com. Looking back and looking forward.

E N D
Planning, preparing and thinking about level 2 WMA 21 November 2011
Introductions Anne Lawrence Centre for Educational DevelopmentMassey University Palmerston North a.lawrence@massey.ac.nz http://ced-mxteachers-news-site.wikispaces.com
Looking back and looking forward Level one: What have we learned? Level two: Many possibilities for courses Implications for teachingmathematics
Looking back: what have we learned? Getting started Externals Teaching Level one Internals Learning Assessing Numeracy Achievement stds Unit standards
Level one exams: teacher feedback Getting started The graphs & patterns had two questions on discontinuous step functions . There was nothing like this in the one exemplar provided and our students had no idea how to do it. Furthermore, as these were the first two questions a lot of our students gave up and did not attempt the bits they could do. The Trig & Geometry standard had a 3D question when the standard specifically states " use trigonometric ratios and Pythagoras' theorem in two dimensions" and out of all the angle properties, there were 5 questions about cyclic quadrilaterals! Why write an exam that is substantially different from the exemplar? Why have the different material as the first two questions? Why put the familiar material at the end of the question? Why have so many questions on cyclic quads?
Looking back at our courses Getting started What were the successes for students? What didn’t work well for students? Levelone What needs changing? What did we do well?
Level two courses Getting started Many possibilities Discuss, explore, explain….
Looking forward Getting started What changes do we need to make? What will we do to support our students? Level two What else could we consider? What do we want to keep?
Level two courses… one possibility Getting started
Level two courses… another option Getting started
Level three courses … one possibility Getting started
Why learn mathematics? Getting started
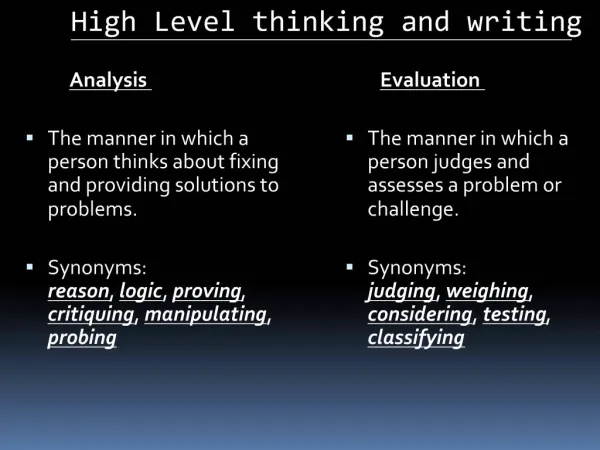
Why learn mathematics? Getting started Learning to think mathematically Logical thinking Problem solving Understanding concepts Developing mathematical skills
Thinkingand Understanding… Getting started Conceptual understanding demands knowing what, knowing how, knowing why, and knowing when (to apply). In a range of meaningful contexts, students will be engaged in thinking mathematically and statistically. They will solve problems and model situations.
A typical maths classroom Getting started Sketch a graph(s) showing time spent on practice exercises, and time spent on problem solving during a typical unit.
A typical maths classroom Getting started Most of the time students are doing practice exercises. Some time is devoted to problem solving activities but they are usually at the end of the lesson or topic.
Just a bunch of rules to remember Getting started Is it surprising that students think of mathematics as a bunch of rules and procedures? What should the graph look like if we want to change the way students think about mathematics?
Thinking comes from problem solving Getting started We need a good source of rich tasks that we can use for teaching (yes, for assessing too).
Worthwhile tasks Two Classrooms Tasks that provide students with the opportunity to develop and show their reasoning and mathematical thinking. Tasks which allow for student choice about the mathematics and the problem-solving strategies they use to model and investigate situations. Tasks that require students to call on their mathematical knowledge and search for a pathway to the answer.
Sources of worthwhile tasks NCTM http://www.nctm.org Horseshoes in flight Balanced assessment http://balancedassessment.concord.org The catenary problem Mathematics assessment project http://map.mathshell.org Lines and rectangles NRICH http://nrich.maths.org Tangled trig graphs
Exploring tasks Getting started • Jigsaw activity: • Go to expert groups to explore a task • Your task is to report back to your ‘home’ group about the task you explored in your expert group. • Key questions: • Where would this task fit? • How can I extend the task? • What prompts, probes, scaffolding would be useful for students who are stuck?
nrich: eg Tangled graphs Getting started http://nrich.maths.org Here is a pattern I made with some graphs of trigonometric function.
Tangled trig graphs (cont) Getting started The purple line is the graph y=sinx. Can you identify the coordinates of the points where it crosses the axes and where it reaches its maximum and its minimum values? How could I make the red graph from the purple graph? Can you work out the equation of the red graph?
Tangled trig graphs (cont) Getting started Imagine you had a graphical calculator but the sine button is broken. Can you draw the same patterns using the cosine function instead? Explain how you can transform a cosine graph into a sine graph. The green graph has equation y=sin2x. Can you describe how to make the green graph from the purple graph? How does the transformation of the graph relate to the way the equation has changed? Using these ideas, can you work out the equations of the other graphs I have drawn?
Mathematics Assessment Project (MAP) Getting started http://map.mathshell.org
Balanced assessment Getting started http://balancedassessment.concord.org
Are you a Maths Problem Solver? • CONCLUDE • Finishing it up. • What is my final answer? • Is my solution communicated clearly? • What are the success criteria? • EXPLORE • Make sense of the problem and connect it to what I have learned. • Investigate/Play with what is given in the problem. • What methods from my toolbox can I use? • What else do I need to figure out? • EXTEND • How do I show relational and extended abstract thinking? • Explore the problem further. • Identify patterns, relationships and exceptions. • Abstracting • Reflect on my solution. • SOLVE • Changethe words into a maths problem and solve it. • Organize and sort my exploration. • Construct useful diagrams or models. • Turn words into labels. • Apply methods from my toolbox. • Record my steps. Solving problems? Use the PESEC cycle! PROBLEM? In your own words what is being asked? Read and reread. Sketch initial diagram. Explain the problem in your own words. What sort of answer am I looking for?
Putting your own spin on this Think about any standard topic Recast the content as questions that students can explore Resist the temptation to tell students the content . Believe that students can investigate and derive relationships and mathematical concepts.
Consider finding x and y intercepts How do you currently teach this?
Consider finding x and y intercepts Ask students to look at a graph and identify the intercepts Ask students why these points may be of interest to someone trying to interpret the graph Create a context for a graph that requires interpretation of one of the intercepts Ask students to create their own rules and to compare these to the textbook rules. Why do the rules work? Ask students to graph a “messy” equation that’s difficult to graph: something like: 33x + 14y = 231
Looking back and looking forward Reflection on level one Thinking about level two courses Why learn mathematics? Teaching through problem solving: horseshoes in flight - http://www.nctm.org the catenary problem -http://balancedassessment.concord.org tangled trig graphs -http://nrich.maths.org lines and rectangles -http://map.mathshell.org
Thank you http://ced-mxteachers-news-site.wikispaces.com
Good problem solving tasks… Two Classrooms use contexts familiar to the students; what is problematic is the mathematics rather than the situation encourage students to use intuitive solutions as well as knowledge and skills they already possess can have several solutions challenge students to use the strategy that would highlight the depth of their understanding of the concept involved allow students to show the connections they have made between the concepts they have learned
Accessing tasks Two Classrooms How can we ensure all students can access these tasks? How can we provide support and still maintain levels of cognitive demand?
What support do students need to tackle demanding tasks? What scaffolding is appropriate? What prompts would teachers want to give? How can we provide support without reducing the cognitive demand? Supporting, Scaffolding, Prompting…
MAP eg Lines and rectangles Getting started
Lines and rectangles (cont) Lines and Rectangles Line segment SP has equation y = 2x + 3. P S Find the equationsof the line segmentsforming the otherthree sides of the rectangle. Q R
Balanced assessment eg The Catenary problem Getting started Find the curve assumed by a loose chain hung freely from two fixed points. 1. Look at a chain of that kind or imagine its shape. Trace its shape on a piece of paper. Measure it and analyze its values at different points. Write an expression which represents this function, and explain why you chose this expression. 2. For a long time this curve was thought of as a parabola. Then it turned out that the precise description of the hanging chain can be given by the combination of two exponential functions: . The values of this function are very hard to compute without calculators. It is therefore useful to find out how good an approximation to the catenary shape other functions provide.
The Catenary problem (cont) Getting started Graph both functions: the function you have picked as your representative function and the given function f(x). Sketch the two functions on the same coordinate system. Describe the differences between themin the region of -5 < x < 5: a. For how many different values of x do they intersect? b. Consider the functional representation of the slope of each function; compare the two. (How many times do the slope functions intersect?) c. Suggest another method to compare the two functions. 3. Devise a way to present how close the two graphs are for any value of x (any width of the hanging chain). Explain your decisions. 4. Extension: Devise a way to estimate the length of the catenary without using any measurement tool.
nctmeg Horseshoes in flight http://www.nctm.org
1. Which expression is the most useful for finding the maximum height of the horseshoe, and why is it the most useful expression? 2. What information can you conclude about the horseshoe’s flight from other equivalent expressions? Explain your answers.