Download
1 / 1
20 likes | 145 Views
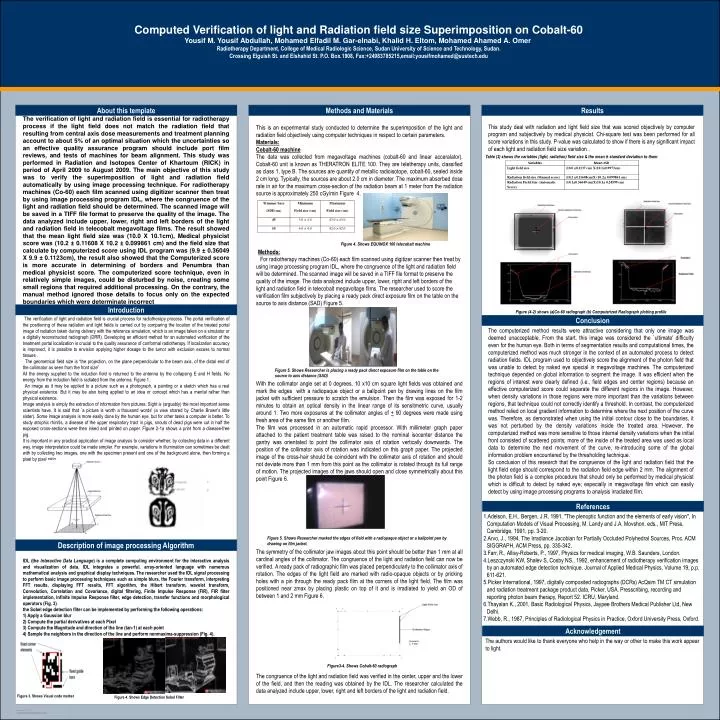
Computed Verification of light and Radiation field size Superimposition on Cobalt-60 Yousif M. Yousif Abdullah, Mohamed Elfadil M. Gar-elnabi, Khalid H. Eltom, Mohamed Ahamed A. Omer

E N D
Computed Verification of light and Radiation field size Superimposition on Cobalt-60 Yousif M. Yousif Abdullah, Mohamed Elfadil M. Gar-elnabi, Khalid H. Eltom, Mohamed Ahamed A. Omer Radiotherapy Department, College of Medical Radiologic Science, Sudan University of Science and Technology, Sudan. Crossing Elguish St. and Elshahid St. P.O. Box.1908, Fax:+24983785215,email:yousifmohamed@sustech.edu About this template Methods and Materials Results The verification of light and radiation field is essential for radiotherapy process if the light field does not match the radiation field that resulting from central axis dose measurements and treatment planning account to about 5% of an optimal situation which the uncertainties so an effective quality assurance program should include port film reviews, and tests of machines for beam alignment. This study was performed in Radiation and Isotopes Center of Khartoum (RICK) in period of April 2009 to August 2009. The main objective of this study was to verify the superimposition of light and radiation field automatically by using image processing technique. For radiotherapy machines (Co-60) each film scanned using digitizer scanner then treat by using image processing program IDL, where the congruence of the light and radiation field should be determined. The scanned image will be saved in a TIFF file format to preserve the quality of the image. The data analyzed include upper, lower, right and left borders of the light and radiation field in telecobalt megavoltage films. The result showed that the mean light field size was (10.0 X 10.1cm), Medical physicist score was (10.2 ± 0.11608 X 10.2 ± 0.099861 cm) and the field size that calculate by computerized score using IDL program was (9.9 ± 0.36049 X 9.9 ± 0.1123cm), the result also showed that the Computerized score is more accurate in determining of borders and Penumbra than medical physicist score. The computerized score technique, even in relatively simple images, could be disturbed by noise, creating some small regions that required additional processing. On the contrary, the manual method ignored those details to focus only on the expected boundaries which were determinate incorrect This study deal with radiation and light field size that was scored objectively by computer program and subjectively by medical physicist. Chi-square test was been performed for all score variations in this study. P-value was calculated to show if there is any significant impact of each light and radiation field size variation . • This is an experimental study conducted to determine the superimposition of the light and radiation field objectively using computer techniques in respect to certain parameters. • Materials: • Cobalt-60 machine • The data was collected from megavoltage machines (cobalt-60 and linear acceralator). Cobalt-60 unit is known as THERATRON ELITE 100. They are teletherapy units, classified as class 1, type B. The sources are quantity of metallic radioisotope, cobalt-60, sealed inside 2 cm long. Typically, the sources are about 2.0 cm in diameter. The maximum absorbed dose rate in air for the maximum cross-section of the radiation beam at 1 meter from the radiation source is approximately 250 cGy/min Figure 4. • Methods: • For radiotherapy machines (Co-60) each film scanned using digitizer scanner then treat by using image processing program IDL, where the congruence of the light and radiation field will be determined. The scanned image will be saved in a TIFF file format to preserve the quality of the image. The data analyzed include upper, lower, right and left borders of the light and radiation field in telecobalt megavoltage films. The researcher used to score the verification film subjectively by placing a ready pack direct exposure film on the table on the source to axis distance (SAD) Figure 5. • With the collimator angle set at 0 degrees, 10 x10 cm square light fields was obtained and mark the edges with a radiopaque object or a ballpoint pen by drawing lines on the film jacket with sufficient pressure to scratch the emulsion. Then the film was exposed for 1-2 minutes to obtain an optical density in the linear range of its sensitmetric curve, usually around 1. Two more exposures at the collimator angles of + 90 degrees were made using fresh area of the same film or another film. • The film was processed in an automatic rapid processor. With millimeter graph paper attached to the patient treatment table was raised to the nominal isocenter distance the gantry was orientated to point the collimator axis of rotation vertically downwards. The position of the collimator axis of rotation was indicated on this graph paper. The projected image of the cross-hair should be coincident with the collimator axis of rotation and should not deviate more than 1 mm from this point as the collimator is rotated through its full range of motion. The projected images of the jaws should open and close symmetrically about this point Figure 6. • The symmetry of the collimator jaw images about this point should be better than 1 mm at all cardinal angles of the collimator. The congruence of the light and radiation field can now be verified. A ready pack of radiographic film was placed perpendicularly to the collimator axis of rotation. The edges of the light field are marked with radio-opaque objects or by pricking holes with a pin through the ready pack film at the corners of the light field. The film was positioned near zmax by placing plastic on top of it and is irradiated to yield an OD of between 1 and 2 mm Figure 6. • The congruence of the light and radiation field was verified in the center, upper and the lower of the field, and then the reading was obtained by the IDL. The researcher calculated the data analyzed include upper, lower, right and left borders of the light and radiation field. Table (2) shows the variables (light, radiation) field size & the mean ± standard deviation to them. Figure 4. Shows EQUINOX 100 telecobalt machine Introduction The verification of light and radiation field is crucial process for radiotherapy process. The portal verification of the positioning of these radiation and light fields is carried out by comparing the location of the treated portal image of radiation taken during delivery with the reference simulation, which is an image taken on a simulator or a digitally reconstructed radiograph (DRR). Developing an efficient method for an automated verification of the treatment portal localization is crucial to the quality assurance of conformal radiotherapy. If localization accuracy is improved, it is possible to envision applying higher dosage to the tumor with exclusion excess to normal tissues . The geometrical field size is “the projection, on the plane perpendicular to the beam axis, of the distal end of the collimator as seen from the front size” All the energy supplied to the induction field is returned to the antenna by the collapsing E and H fields. No energy from the induction field is radiated from the antenna. Figure 1. An image as it may be applied to a picture such as a photograph, a painting or a sketch which has a real physical existence. But it may be also being applied to an idea or concept which has a mental rather than physical existence. Image analysis is simply the extraction of information from pictures. Sight is (arguably) the most important sense scientists have. It is said that `a picture is worth a thousand words' (a view shared by Charlie Brown's little sister). Some image analysis is more easily done by the human eye, but for other tasks a computer is better. To study atrophic rhinitis, a disease of the upper respiratory tract in pigs, snouts of dead pigs were cut in half the exposed cross-sections were then inked and printed on paper. Figure 2-1a shows a print from a disease-free pig. It is important in any practical application of image analysis to consider whether, by collecting data in a different way, image interpretation could be made simpler. For example, variations in illumination can sometimes be dealt with by collecting two images, one with the specimen present and one of the background alone, then forming a pixel by pixel ratio. Figure (4-2) shows (a)Co-60 radiograph (b) Computerized Radiograph plotting profile Conclusion The computerized method results were attractive considering that only one image was deemed unacceptable. From the start, this image was considered the `ultimate' difficulty even for the human eye. Both in terms of segmentation results and computational times, the computerized method was much stronger in the context of an automated process to detect radiation fields. IDL program used to objectively score the alignment of the photon field that was unable to detect by naked eye special in megavoltage machines. The computerized technique depended on global information to segment the image. It was efficient when the regions of interest were clearly defined (i.e., field edges and center regions) because an effective computerized score could separate the different regions in the image. However, when density variations in those regions were more important than the variations between regions, that technique could not correctly identify a threshold. In contrast, the computerized method relied on local gradient information to determine where the next position of the curve was. Therefore, as demonstrated when using the initial contour close to the boundaries, it was not perturbed by the density variations inside the treated area. However, the computerized method was more sensitive to those internal density variations when the initial front consisted of scattered points; more of the inside of the treated area was used as local data to determine the next movement of the curve, re-introducing some of the global information problem encountered by the thresholding technique. So conclusion of this research that the congruence of the light and radiation field that the light field edge should correspond to the radiation field edge within 2 mm. The alignment of the photon field is a complex procedure that should only be performed by medical physicist which is difficult to detect by naked eye; especially in megavoltage film which can easily detect by using image processing programs to analysis irradiated film. Figure 5. Shows Researcher is placing a ready pack direct exposure film on the table on the source to axis distance (SAD) A B References Adelson, E.H., Bergen, J.R. 1991. "The plenoptic function and the elements of early vision", In Computation Models of Visual Processing, M. Landy and J.A. Movshon, eds., MIT Press, Cambridge, 1991, pp. 3-20. Arvo, J., 1994, The Irradiance Jacobian for Partially Occluded Polyhedral Sources, Proc. ACM SIGGRAPH, ACM Press, pp. 335-342. Farr, R., Allisy-Roberts, P., 1997, Physics for medical imaging, W.B. Saunders, London. Leszczynski KW, Shalev S, Cosby NS., 1992, enhancement of radiotherapy verification images by an automated edge detection technique. Journal of Applied Medical Physics, Volume 19, p.p. 611-621. Picker International, 1997, digitally composited radiographs (DCRs) AcQsim TM CT simulation and radiation treatment package product data, Picker, USA. Presscribing, recording and reporting photon beam therapy, Report 52. ICRU, Maryland. Thayalan K., 2001, Basic Radiological Physics, Jaypee Brothers Medical Publisher Ltd, New Delhi. Webb, R., 1987, Principles of Radiological Physics in Practice, Oxford University Press, Oxford. Figure 5. Shows Researcher marked the edges of field with a radiopaque object or a ballpoint pen by drawing on film jacket. Description of image processing Algorithm IDL (the Interactive Data Language) is a complete computing environment for the interactive analysis and visualization of data. IDL integrates a powerful, array-oriented language with numerous mathematical analysis and graphical display techniques. The researcher used the IDL signal processing to perform basic image processing techniques such as simple blurs, the Fourier transform, interpreting FFT results, displaying FFT results, FFT algorithm, the Hibert transform, wavelet transform, Convolution, Correlation and Covariance, digital filtering, Finite Impulse Response (FIR), FIR filter implementation, Infinite Impulse Response filter, edge detection, transfer functions and morphological operators (Fig. 3). the Sobel edge detection filter can be implemented by performing the following operations: 1) Apply a Gaussian blur 2) Compute the partial derivatives at each Pixel 3) Compute the Magnitude and direction of the line (tan-1) at each point 4) Sample the neighbors in the direction of the line and perform nonmaxima-suppression (Fig. 4). . Acknowledgement The authors would like to thank everyone who help in the way or other to make this work appear to light. Figure3-4. Shows Cobalt-60 radiograph Figure 3. Shows Visual code marker Figure 4. Shows Edge Detection Sobel Filter