Download
1 / 108
1.08k likes | 1.36k Views
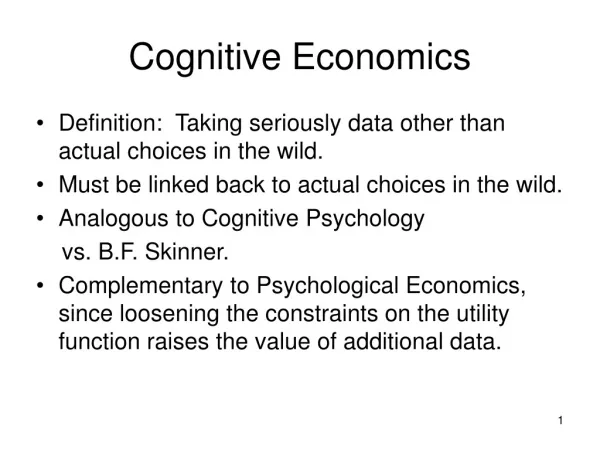
Cognitive Economics. Miles Kimball University of Michigan Presentation at Osaka University. Definition of Cognitive Economics:. The Economics of What is in People’s Minds. Named by Analogy to “Cognitive Psychology”.

E N D
Cognitive Economics Miles Kimball University of Michigan Presentation at Osaka University
Definition of Cognitive Economics: The Economics of What is in People’s Minds
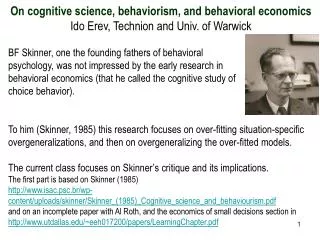
Named by Analogy to “Cognitive Psychology” • Cognitive Psychology = the area of psychology that examines internal mental processes such as problem solving, memory and language. • Cognitive Psychology was a departure fromBehaviorism--the idea that only outward behavior was a legitimate subject of study.
How is “Cognitive Economics” Different from “Behavioral” or “Psychological” Economics? • Cognitive economics is narrower. • Much of cognitive economics is inspired by the internal dynamic of economics rather than by psychology. • Cognitive economics is a field of study, not a school of thought.
Areas of Economics by Distinctive Data Type • Standard Economics (including “Mindless” Psychological Economics a la Gul and Pesendorfer): actual market choices only. • Experimental Economics: choices in artificial situations but with real stakes. • Neuroeconomics: FMRI, saccades, skin conductance, … • Bioeconomics: genes, hormones • Cognitive Economics: mental contents (based on tests and self-reports) and hypothetical choices.
Four Themes of Cognitive Economics • New Types of Data • Heterogeneity • Finite and Scarce Cognition • Welfare Economics Revisited
1. Innovative Survey Data • fluid intelligence data • crystallized intelligence data • happiness data • survey measures of expectations • survey measures of preferences
2. Individual Heterogeneity • heterogeneous expectations • heterogeneous preferences • heterogeneous emotional reactions • heterogeneous views on how the world works (folk theories)
3. Finite and Scarce Cognition • Finite cognition=the reality that people are not infinitely intelligent. • Scarce cognition=some decisions required by our modern environment—at work and in private lives—can require more intelligence for full-scale optimization than an individual has
4. Welfare Economics Revisited • Scarce cognition means that people sometimes make mistakes. Thus, one can no longer use naïve revealed preference for welfare economics. • Kimball and Willis, in “Utility and Happiness,” argue that happiness data is not a magical touchstone for diagnosing mistakes. • Then, what does count as evidence of mistakes? • Internal inconsistencies, such as lack of transitivity? But which choice then deserves respect? • Regret? • Modification of choices after experience? • Differences in choices between those with high cognitive ability and those with low cognitive ability? • e.g., Dan Benjamin and Jesse Shapiro show that low IQ students had more low-stakes risk aversion and short-horizon impatience
Some Research Questions in Cognitive Economics • Seek to make innovations in economic theory and measurement to address: • What are people’s limitations in knowledge, memory, reasoning, calculation? • What is the role of emotion, social context, conscious vs. unconscious judgments and decisions? • What is the role of health as determinant, outcome and context for economic activity, decisions and well being? • What is connection between economic welfare and measures of well being? • Etc.
New Types of Data:Measurement of Cognition in the HRS • HRS has included cognitive measures from the outset, but mostly focused on memory in order to trace cognitive decline. • Re-engineering HRS cognitive measures • Led by Jack McArdle, a cognitive psychologist and HRS co-PI, we have begun a project to “re-engineer” our cognitive measures in order to improve our understanding of the determinants of decision-making about retirement, savings and health and their implications for the well-being of older Americans
New Types of Data: Measurement of Cognition in the HRS (cont.) • Separate HRS-Cognition Study • Begins with a separate sample of 1200 persons age 50+ who will receive about three hours of cognitive testing of their fluid and crystallized intelligence plus parts of the HRS questionnaire on demographics, health and cognition • Followed a month later by administration of an internet or mail survey of questions designed by economists on financial literacy, ability to compound-discount, hypothetical decisions about portfolio choice, long term care • Finally, telephone follow-up with HRS cognition items and subjective probability questions • Analysis of data will guide re-engineering of cognitive items for HRS-2010
New Types of Data: Survey Measures of Expectations What is the mapping between probability beliefs in people’s minds and the decisions they make? (Robert Willis, Charles Manski, Mike Hurd, Jeff Dominitz, Adeline Delavande)
Direct Measurement of Subjective Probability Beliefs in HRS Probability questions use a format pioneered by Tom Juster and Chuck Manski (Manski, 2004) HRS Survival Probability Question: “Using a number from 0 to 100, what do you think are the chances that you will live to be at least [target age X]?” X = 80 for persons 50 to 70 and increases to 85, 90, 95, 100 for each five year increase in age
Two Key Findings From Previous Research on HRS Probability Questions 1. On average, probabilities make sense • Survival probabilities conform to life tables and are predictive of actual mortality (Hurd and McGarry 1995, 2002; Sloan, et. al., 2001 ) • Bequest probabilities behave sensibly (Smith 1999), Perry (2006) • Retirement incentives can be analyzed using expectational data (Chan and Stevens, 2003) • People can predict nursing home entry (Finkelstein and McGarry, 2006) • Early Social Security Claiming Depends on Survival Probability (Delevande, Perry and Willis, 2006) , (Coile, et. al., 2002) 2. Individual probabilities are very noisy with heaping on focal values of "0", "50-50" and "100“ (Hurd, McFadden and Gan, 1998)
10 Year Mortality Rate vs. Subjective Survival Probability to Age 75 Odds Ratio of Death by t+10 Subjective Survival Probability at Time t Source: Mortality Computations from HRS-2002 by David Weir
10 Year Mortality Rate vs. Subjective Survival Probability to Age 75 Strongest relationship between subjective and objective risks for people with low subjective survival beliefs Odds Ratio of Death by t+10 Subjective Survival Probability at Time t Source: Mortality Computations from HRS-2002 by David Weir
. Histograms of Responses to Probability Questions in the HRS A. General Events Social Security less generous Double digit inflation B. Events with Personal Information Survival to 75 Income increase faster than inflation C. Events with Personal Control Leave inheritance Work at age 62
Are Benefits of Greater Individual Choice Influenced by Quality of Probabilistic Thinking? • Trend of increasing scope for individual choice in public and private policy, especially as it affects those planning for retirement or already retired • Private sector shift from defined benefit to defined contribution pension plans • Proposals for “individual accounts” in Social Security • Choice of when/whether to annuitize • Choice of medical insurance plans and providers by employers and by Medicare, new Medicare Prescription Drug program • Economists generally view increased choice as a good thing, but … • General public wonders whether people will make wise use of choice • Decisions faced by older individuals balancing risks and benefits of alternative financial and health care choices are genuinely difficult
Quality of Probabilistic Thinking and Uncertainty Aversion • Lillard and Willis (2001) began to look at the pattern of responses to probability questions as indicators of the degree to which they indicate people’s capacity to think clearly about subjective probability beliefs • We explored the idea that focal answers of “0”, “50” and “100” were perhaps indicators of less coherent or well-formed beliefs than non-focal (or “exact”) answers.
Index of Focal Responses We treated the probability questions like a psychological battery and constructed an empirical propensity to give focal answers of “0”, “50” or “100” We found that people who had a lower propensity to give focal answers tended to have higher wealth, had riskier portfolios, and achieved higher rates of return, controlling for conventional economic and demographic variables
Uncertainty Aversion • We hypothesized that people who give more focal answers are more uncertain about the true value of probabilities • If the uncertainty is about a repeated risk, such as the return to a stock portfolio held over time, we show that people who have more imprecise probability beliefs (i.e. are more uncertain about the “true” probability) will behave more risk aversely
Some Further Results on Subjective Probabilities • There is “optimism factor” common across all probability questions which is correlated with stock-holding and associated with being “healthy, wealthy and wise” • Kezdi and Willis (2003) • HRS has added direct questions on stock returns • stockholding is related to probability beliefs • Kezdi and Willis (2003) and Dominitz and Manski (2006) • most people do not believe that stocks have positive returns, despite the equity premium that economists know about • Persons who provide more precise probability answers also exhibit less risk aversion on subjective risk aversion questions in the HRS, and they save a higher fraction of their full wealth. • Sahm (2007), Pounder (2007) • In 2006, HRS added questions to those who answer “50” to see whether they mean “equally probable” or “just uncertain”. 75% indicate they are uncertain.
New Types of Data: Survey Measures of Preferences Based on Hypothetical Choices Examples: • Labor Supply Elasticities, • Altruism, • Social Rivalry, • Risk Aversion, • Elasticity of Intertemporal Substitution
Does Risk Tolerance Change? Claudia Sahm University of MichiganBoard of Governors
Measuring Time Preference and the Elasticity of Intertemporal Substitution Miles S. Kimball, Claudia R. Sahm and Matthew D. Shapiro September 6, 2006 Internet Project Meeting