Download
1 / 20
200 likes | 384 Views
Daniel J. Jacob. Using satellites to estimate US methane emissions. with Kevin Wecht , Alex Turner, Melissa Sulprizio. with support from the NASA Carbon Monitoring System. Importance of methane for climate policy. Present-day emission-based forcing of methane is 0.95 W m -2 ,

E N D
Daniel J. Jacob Using satellites to estimate US methane emissions with Kevin Wecht, Alex Turner, Melissa Sulprizio with support from the NASA Carbon Monitoring System
Importance of methane for climate policy • Present-day emission-based forcing of methane is 0.95 W m-2 , • compared to 1.8 W m-2 for CO2 (IPCC AR5) • Climate impact of methane is comparable to CO2 over 20-year horizon • Methane emission control is a low-cost option for climate policy • Increases in natural gas production/use, hydrofracking have potential to increase US source of methane • Methane is a central piece of the President’s Climate Action Plan
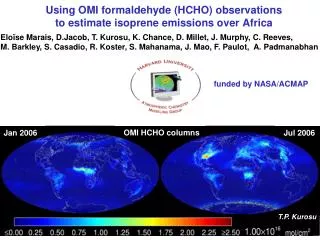
Building a methane monitoring system for N America EDGAR emission Inventory for methane Can we use satellites together with suborbital observations of methane to monitor methane emissions on the continental scale and test/improve emission inventories in a manner useful to stakeholders?
Methane bottom-up emission inventories for N. America: EDGAR 4.2 (anthropogenic), LPJ (wetlands) N American totals in Tg a-1 Surface/aircraft studies suggest that these emissions are too low by ~factor 2
Methane observing system in North America Satellites AIRS, TES, IASI Thermal IR TROPOMI GCIRI 1-day geo GOSAT 3-day, sparse SCIAMACHY 6-day Shortwave IR 2002 2006 2009 20015 2018 Suborbital 1/2ox2/3o grid of GEOS-Chem chemical transport model (CTM) INTEX-A SEAC4RS CalNex
High-resolution inverse analysis system for quantifying methane emissions in North America Observations EDGAR 4.2 + LPJ a priori bottom-up emissions GEOS-Chem CTM and its adjoint 50 km resolution over N. America nested in 4ox5o global domain Bayesian inversion Validation Verification Optimized emissions at 50 km resolution The same inverse analysis system is used at JPL for CO2 (K. Bowman, PI)
North American methane emission estimates optimized by SCIAMACHY + INTEX-A data (Jul-Aug 2004) SCIAMACHY column methane mixing ratio Correction factors to EDGAR emissions 1000 clusters ppb 1700 1800 EDGAR v4.2 26.6 EPA 28.3 This work 32.7 US anthropogenic emissions (Tg a-1) Livestock emissions are underestimated by EPA, oil/gas emissions are not Wecht et al., in prep.
GOSAT methane column mixing ratios, Oct 2009-2010 Retrieval from U. Leicester
Inversion of GOSAT Oct 2009-2010 methane Correction factors to prior emissions (EDGAR 4.2 + LPJ) Nested inversion with 50x50 km2 resolution Alex Turner, Harvard Next step: clustering of emissions in the inversion, use new NASA retrieval
Testing the information content of satellite data with CalNex inversion of methane emissions Correction factors to EDGAR CalNex observations GEOS-Chem w/EDGAR v4.2 May-Jun 2010 S. Wofsy (Harvard) 1800 2000 ppb California emissions (Tg a-1) EDGAR v4.2 1.92 CARB 1.51 This work 2.86 Wecht et al., in prep.
GOSAT observations of methane are too sparse to constrain California emissions GOSAT data (CalNex period)) Correction factors to EDGAR emissions 0.5 1.5 Each point = 1-10 observations …but they do provide qualitative indication of corrections to emission inventories Wecht et al., in prep.
TROPOMI (2015 launch) will constrain methane emissions as well as a CalNex-type aircraft campaign Correction factors to EDGAR emissions in observation system simulation experiment (OSSE) inversions for CalNex period A geostationary mission (several current proposals) would allow fine-scale monitoring Wecht et al., in prep.
Working with stakeholders at the US state level State-by-state analysis of SCIAMACHY correction factors to EDGARv4.2 emissions with Iowa Dept. of Natural Resources (Marnie Stein) State emissions computed w/EPA tools too low by x3.5; now investigating EPA livestock emission factors Hog manure? 0 1 2 correction factor with New York Attorney General Office (John Marschilok) State-computed emissions too high by x0.6, reflects overestimate of gas/waste/landfill emissions Large EDGAR source from gas+landfills is just not there Melissa Sulprizio and Kevin Wecht, Harvard
Develop a clustering algorithm to extract the maximum information from the GOSAT satellite data • Impose a temperature dependence on livestock emissions (can we assume no seasonality for oil/gas emissions?) • Conduct a 2009-present inversion of GOSAT data together with surface observations (NOAA, TCCON), interpret results • Interact with stakeholders (API!) on the implications of results and to guide future work • Get ready for TROPOMI! What next?
Pollution monitoring Exposure assessment AQ forecasting Source attribution Quantifying emissions External influences AQ processes Climate interactions satellites AQAST suborbital platforms models AQAST
Daniel Jacob (leader), Loretta Mickley (Harvard) • Tracey Holloway (deputy leader), Steve Ackerman (U. Wisconsin); Bart Sponseller (Wisconsin DNR) • Greg Carmichael (U. Iowa) • Dan Cohan (Rice U.) • Russ Dickerson (U. Maryland) • Bryan Duncan, Yasuko Yoshida, Melanie Follette-Cook • (NASA/GSFC); Jennifer Olson (NASA/LaRC) • David Edwards (NCAR) • Arlene Fiore (Columbia Univ.); Meiyun Lin (Princeton) • Jack Fishman, Ben de Foy (Saint Louis U.) • DavenHenze, Jana Milford (U. Colorado) • Edward Hyer, Jeff Reid, Doug Westphal, Kim Richardson (NRL) • Pius Lee, TianfengChai(NOAA/NESDIS) • Yang Liu, Matthew Strickland (Emory U.), Bin Yu (UC Berkeley) • Richard McNider, ArastooBiazar (U. Alabama – Huntsville) • Brad Pierce (NOAA/NESDIS) • Ted Russell, YongtaoHu, TalatOdman (Georgia Tech); Lorraine Remer (NASA/GSFC) • David Streets (Argonne) • Jim Szykman (EPA/ORD/NERL) • Anne Thompson, William Ryan, SuellenHaupt (Penn State U.) AQAST members
What makes AQAST unique? • All AQAST projects connect Earth Science and air quality management: • active partnerships with air quality managers with deliverables/outcomes • self-organizing to respond quickly to demands • flexibility in how it allocates its resources • INVESTIGATOR PROJECTS (IPs): members adjust work plans each year to meet evolving AQ needs • “TIGER TEAM” PROJECTS (TTs): multi-member efforts to address emerging, pressing problems requiring coordinated activity www.aqast.org: click on “projects” for brief descriptions + link to pdf describing each project • Recently selected Tiger Team projects include: • Web-enabled AQ management tools • AQ reanalysis • Dynamical natural inputs for AQ models • Source attribution for O3 and PM events over EUS • Oil & gas emissions • Satellite-derived NOx emissions and trends
AQ agency SIP Modeling AQ processes Monitoring AQ-Climate Background IC/BC for AQ models Forecasting Emissions Future satellites • Local: RAQC, BAAQD • State: TCEQ, MDE, • Wisconsin DNR, CARB, • Iowa DNR, GAEPD, GFC • Regional: LADCO, EPA Region 8 • National: EPA, NOAA, • NPS Scope of current AQAST projects We need to find Industry partners! Theme Satellites: MODIS, MISR, MOPITT, AIRS, OMI, TES, GOES, GOME-2 Suborbital: ARCTAS, DISCOVER-AQ, ozonesondes, PANDORA Models: MOZART, CAM, AM-3, GEOS-Chem, RAQMS, STEM, GISS, CMIP Earth Science resource
To subscribe to newsletter, send email to aqast_news-join@seas.harvard.edu (leave subject and body blank)
Semiannual AQAST meetings • Share knowledge and experience in using Earth Science data and tools for serving AQ management • Educate AQ managers in the use of Earth Science data and tools, educate Earth scientists on AQ needs • Hear about pressing AQ management issues, and determine how AQAST can help Next meeting (AQAST 6) is January 15-17 in Houston: http://acmg.seas.harvard.edu/aqast/meetings/2014_jan We hope to have API members attend, and present! AQAST meeting at U. Maryland (June 9-11, 2013)