Download
1 / 47
490 likes | 772 Views
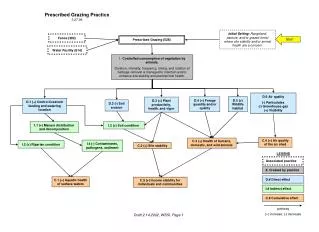
Prescribed Grazing Training. NRCS-Idaho June 6 &13, 2007. Stocking Rates. First We Will Review How to Calculate the Basic Stocking Rate – the Animal Unit Month or AUM. Stocking Rates. What is an AUM You May Ask? It is the amount of forage that a mature, 1000 pound cow needs for a month.

E N D
Prescribed Grazing Training NRCS-Idaho June 6 &13, 2007
Stocking Rates • First We Will Review How to Calculate the Basic Stocking Rate – the Animal Unit Month or AUM
Stocking Rates • What is an AUM You May Ask? • It is the amount of forage that a mature, 1000 pound cow needs for a month. • A mature cow needs approximately 30 lbs. of air-dry forage per day or 900 pounds of forage per month. • Remember, the mature cow is the basic Animal Unit or AU.
Stocking Rates • Before we begin to learn how to calculate the AUM, the NRCS conservationist must remember that NRCS ONLY recommends suggested, initial stocking rates as a starting point in management. NRCS does not “fix” set stocking rates for ranches. Stocking rates are fluid, and change with yearly precipitation patterns.
Stocking Rates • Remember that all suggested stocking rates must interpreted intelligently and judiciously. • Suggested stocking rates must change during times of drought. A field assessment of forage resources during drought is necessary if the cooperator requests assistance.
Stocking Rates • How do I calculate the AUM you may ask? • First, you must conduct field forage inventories. • You must have air-dry weights of forage converted to pounds per acre
Stocking Rates • Now that we have that background let’s review the simple and basic equation for calculating the AUM. • First, lets determine amounts of forage in air-dry pounds per acre. • Next, you should discuss with the cooperator’s their best knowledge of percent utilization of forage.
Stocking Rates • In some instances, of Management Intensive Grazing, the cooperator may have as high as 50 percent to 60 percent of total forage utilization. • If the cooperator has a less intensive grazing system or percent utilization of forage cannot be determined then calculate a conservative stocking rate.
Stocking Rates • Therefore, when determining a safe and suggested, conservative stocking rate remember the following. • “Take Half, Leave Half”. We wish to leave at least 50 percent of the annual, total forage standing on the ground for conservation purposes.
Stocking Rates • Next, of the “half” that we have taken for grazing availability, half of the amount is lost or rendered unusable due to trampling and deposition of manure and urine. • This amount of forage, in pounds per acre, will be the amount available for livestock consumption.
Stocking Rates • Next, we will assume that the mature cow needs 30 pounds of air-dry forage per day. • We will also assume that the there are 30 days in a month. • The AUM calculation formula will be as follows:
Stocking Rates • Pounds per acre of available forage multiplied by percent utilization divided by 30 divided by 30 will be equal to AUM’s per acre. The reciprocal of this answer will equal acres per AUM. • Let’s run through an example for clarity sake.
Stocking Rate • Let’s assume that our field forage inventories determined that there is 600 air-dry pounds of bluebunch wheatgrass per acre on a hypothetical ranch. • We next apply the “Take Half, Leave Half” rule of thumb. 600 lbs/ac x 0.50 = 300 lbs/ac
Stocking Rates • Next, lets apply the take half of the half that was left over: • 300 lbs/ac x 0.50 = 150 lbs/ac OR • 600 lbs/ac x 0.25 (percent “Harvest Efficiency) = 150 lbs/ac of available bluebunch wheatgrass
Stocking Rates • 150 lbs/ac ÷ 30 lbs/daily needed forage ÷ 30 days = 0.17 AUM’s per acre OR • 150 lbs/ac ÷ 900 lbs/monthly forage needs = 0.17 AUM’s per acre • 1 / 0.17 AUM’s per acre = 6 acres per AUM
Stocking Rates • So we have learned that that 600 lbs of air-dry forage can safely provide about 0.17 animal unit months for every acre or that 6.0 acres will provide about 1 animal unit month (AUM)
Stocking Rates • Questions? Should we run through a few more examples?
Forage Value Rating • Next, let’s discuss the Forage Value Rating system. • The Forage Value Rating system is not a ecological evaluation of the available forage (unlike Percent Similarity Index). It is a utilitarian rating of a specific tract of grazing land for a specific kind of livestock.
Forage Value Rating • Please note Chapter 5 “Management of Grazing Lands” in the National Range and Pasture Handbook. Specifically see page 5.1-20 and Section 3 pages 5.3-3 and 5.3-4. • Please note and follow along with your handout.
Forage Value Rating • How do I go about determining the Forage Value Rating of a given tract of grazing land? • First you must have conducted your field forage inventories and completed the form Idaho-Range-1. • You must know the percent composition of your forages of the Total Average Yield.
Forage Value Rating • Next we must classify all the plants individually in the forage/range inventory as “Preferred”, “Desirable”, and “Undesirable”. • Undesirable plants must also include subcategories of “Nonconsumed” and “Toxic”.
Forage Value Rating • As an example, let’s say we had a pasture that was at least 50 percent bluebunch wheatgrass by air-dry weight, and at least 40 percent Sandberg bluegrass by air-dry weight. • We would have found these values from our completed form Idaho-Range-1.
Forage Value Rating • In our example the pastures are grazed by cow-calf pairs. • We pre-determine that bluebunch wheatgrass is a “Preferred” plant for cattle, and that Sandberg bluegrass is a “Desirable” plant for cattle.
Forage Value Rating • By reviewing the table on page 5.1-20 of the National Range and Pasture Handbook, we can readily see that this tract of grazing land has a Forage Value Rating is “Very High”. • This value can be recorded on the conservation plan map in the inventoried pasture(s) as “Very High FVR”.
Forage Value Rating • In future field observations or future field forage inventories, if we find that more “Desirable” or “Undesirable” plants begin to occur (in percent composition) then we can record a downward trend in Forage Value Rating. Remember, Forage Value Rating must be determined by kind of livestock.
Forage Value Rating • A downward trend in Forage Value Rating should be an indicator that such items as stocking rates may need to be altered, amount of time spent grazing and resting a given pasture/paddock may be reconsidered, and finally how much probable overuse of key forage plants is occuring.
Forage Value Rating • A decline in Forage Value Rating may also or can possibly start being an indicator of a decline in Ecological Rating. Remember our scenario with bluebunch wheatgrass and Sandberg bluegrass. • BE CAREFUL WITH THIS LAST CONCEPT!
Forage Value Rating • Forage Value Rating may not always be an indicator of Ecological Rating. For example in an irrigated pasture, orchardgrass and Kentucky bluegrass are both “Preferred” by cattle. However, orchardgrass is usually the indicator of a higher ecological condition irrigated plant community, and Kentucky bluegrass represents a lower ecological state in our irrigated plant community.
Similarity Index • What is Similarity Index? See pages 4-17 and 4-18 of the National Range and Pasture Handbook. • A Similarity Index is generally expressed as the percentage of vegetation that is presently on the site.
Similarity Index • How do I determine percent Similarity Index? • First of all we need a complete Ecological Site Description or at least a very good understanding of ecological dynamics of our plant community
Similarity Index • For example, let’s return to our native bluebunch wheatgrass plant community. A given tract of bluebunch wheatgrass rangeland could have at least 40 percent to almost 50 percent bluebunch wheatgrass in percent composition by air-dry weight. • A bluebunch wheatgrass dominated community represents our Historic Climax and our Interpretive Community.
Similarity Index • Remember we are talking about native plant communities.
Similarity Index • So, if bluebunch wheatgrass makes up 45 to 50 percent of the plant community we may be at Historic Climax or Potential. • If our plant community rates at 51 percent to 75 percent we are at a High Seral state. • If our plant community rates at 26 percent to 50 percent we are at a Mid Seral state. • Likewise if we rate at 0 to 26 percent we are at a Low Seral State.
Similarity Index • Remember all our seral state ratings are relative to our established Historic Climax or Interpretive Plant Community. • Signs of ecologically declining bluebunch wheatgrass native plant community could be increased Sandberg bluegrass and big sagebrush.
Similarity Index • These previously listed grasses should make you wonder whether the plant community is moving toward a High Seral or Mid Seral state. • Grasses and such as Sandberg bluegrass may be indicators of a movement toward a Low Seral state.
Similarity Index • Percent Similarity Index can assist you and the cooperator in determining what kind of grass or plant community that is best for a given class of livestock. It obviously indicates overstocking, too short of rest periods and too long of grazing periods, and most likely excessive use of key forage plants
AUE’s • What is an AUE? It is simply the Animal Unit Equivalent. According to the National Range and Pasture Handbook-”The animal-unit is a convenient denominator for use in calculating relative grazing impact of different kinds and classes of domestic livestock….”
AUE’s • The AUE’s are simply a way of demonstrating the grazing impact of the different kinds and classes of livestock and some wildlife. • See Table 6-5, Chapter 6, page 6-9 of the National Range and Pasture Handbook.
AUE’s • The most common AUE’s for Idaho will be: • Mature cow with calf = 1 AUE • Yearling/Replacement Heifer = 0.80 AUE • Bull = 1.35 AUE • Horse = 1.25 AUE • Sheep = 0.20 AUE • Goat = 0.15 AUE
AUE’s • How do I calculate AUE’s and then the AUM’s for a ranch? • First inquire of the rancher how many mother cows, replacement heifers, and bulls, for instance. • Next document this on the form Idaho-Range-3.
AUE’s • An example could be a ranch with 125 mature cows, 30 replacement heifers, and 8 bulls. • 125 cows x 1 AUE = 125 AU’s • 30 heifers x 0.80 = 24 AU’s • 8 bulls x 1.35 = 11 AU’s • A total of 160 Animal Units (AU’s) occur on that ranch.
AUE’s • Now that we know how many AU’s are on the ranch let’s calculate AUM’s • Let’s suppose that all livestock stay on the ranch all year round, and are not transported to another unit for grazing.
AUE’s • 125 cow AU’s x 12 months = 1500 AUM’s • 24 heifer AU’s x 12 months = 288 AUM’s • 11 bull AU’s x 12 months = 132 AUM’s • This is a total of 1,920 AUM’s will be needed to support the forage needs of the ranch’s herd.
Forage/Livestock Balance • Now that we know that there are 1,920 AUM’s needed to support the herd we need to compare this with how many AUM’s are being produced from the forage side. See the form Idaho-Range-2. • What if the forage base only produces 1,500 AUM’s per year?
Forage/Livestock Balance • We simply subtract the 1,500 forage AUM’s from the 1,920 animal AUM’s to find the difference. • 1,920 – 1,500 = 420 AUM’s • There is a deficiency of 420 AUM’s. This suggests that the ranch is probably overstocked.
Forage/Livestock Balance • Since there is a deficiency of 420 AUM’s then we should recommend a slight reduction in the herd size. • 420 AUM’s ÷ 12 months = 35 AU’s • It is recommended that the ranch reduce their herd size by 35 AU’s. They may wish to consider reducing the cow herd by 35 individuals.
Forage/Livestock Balance • Should we run through some examples on the form Idaho-Range-3? • Questions?