Download
1 / 45
450 likes | 585 Views
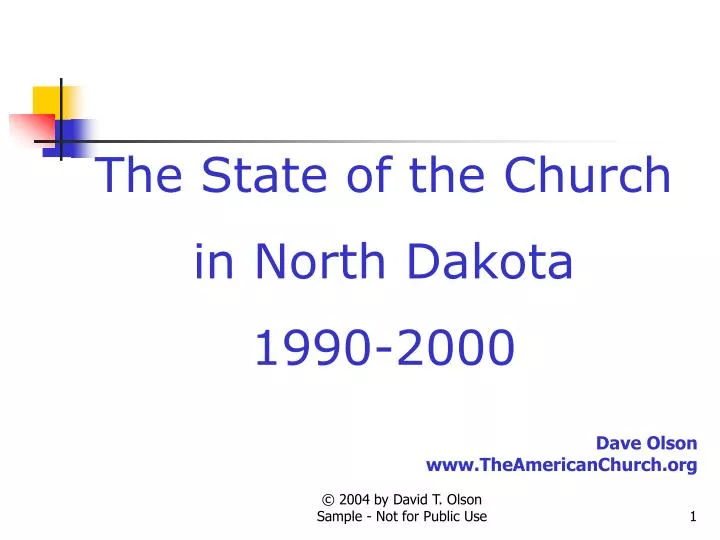
The State of the Church in North Dakota 1990-2000. Dave Olson www.TheAmericanChurch.org.

E N D
The State of the Churchin North Dakota1990-2000 Dave Olson www.TheAmericanChurch.org © 2004 by David T. Olson Sample - Not for Public Use
This is a Sample PresentationIt’s purpose is to give you an idea of what is happening to the Christian church in North Dakota, and what the complete “State of the Church in North Dakota” Powerpoint looks like. The goal is to encourage pastors and church lay leaders to view and discuss together the missional challenges in North Dakota that the Church faces. The complete Powerpoint is $14.95 and is available for immediate download athttp://www.theamericanchurch.org/state/UND20.htm © 2004 by David T. Olson Sample - Not for Public Use
In 1996, polls taken immediately after the Presidential election revealed that 58% of people claimed they had voted, when in reality only 49% actually did. This is called the Halo Effect. People tend to over-inflate their participation in activities that create acceptability within their social group. For many decades, pollsters such as Gallup and Barna have reported that around 45% of Americans attend church every Sunday. But there is a religious Halo Effect. Actual attendance counts have shown that the percentage of people attending church on any given weekend is much lower than was previously thought. © 2004 by David T. Olson Sample - Not for Public Use
The Intent of this presentation is to answer and then expand on two key questions: “How Many People Really Attend Church in North Dakota Every Week?” “Is the Christian Church Going Forwards or Backwards in Influence in North Dakota?” As the data is analyzed county by county assessing a number of factors, a comprehensive picture of the State of the Church in North Dakota will begin to take shape. © 2004 by David T. Olson Sample - Not for Public Use
This study uses weekend church attendance as a more reliable and more immediate snapshot of Christian influence than membership. The following map shows the percentage of the population attending a Christian church on any given weekend in all 50 states in 2000. North Dakota has an attendance percentage (29.4%) that is much higher than the average for the nation (18.7%). © 2004 by David T. Olson Sample - Not for Public Use
The Next Map shows the percentage of the population attending a Christian church on any given weekend in 2000 for each county in North Dakota. © 2004 by David T. Olson Sample - Not for Public Use
30.6% 35.4% 34.1% 32.4% 32.5% 45.5% Divide 36.2% Burke Bottineau Rolette Cavalier Pembina 31.0% Renville Towner 36.5% 22.9% 32.4% Walsh Ward 24.8% 26.1% Williams 35.4% McHenry Ramsey 26.5% Pierce Mountrail 48.3% Benson 26.6% 24.4% Nelson Grand Forks 18.4% 30.2% McKenzie Eddy 41.8% 38.1% Sheridan Wells 40.3% 35.9% 33.6% 35.3% 29.6% McLean 38.4% Foster Griggs Steele Traill Dunn 35.2% Mercer 27.2% Oliver 3.9% 31.7% 27.6% 49.7% 32.0% 31.7% 21.1% Billings Burleigh Kidder Stutsman Golden Valley Barnes Cass 37.4% Stark North Dakota Counties- Percentage of Population Attending a Christian Church on any Given Sunday in 2000 0.0% to 30.6% 33.7% 30.6% to 35.4% Morton 35.4% to 50.7% 44.4% 44.1% 12.8% 35.3% 26.6% Logan Lamoure Slope Ransom 36.9% Hettinger Grant 46.7% 27.8% Emmons Richland 23.9% 46.3% 34.9% 35.1% 32.7% 19.4% Bowman Adams McIntosh Dickey Sargent Sioux
The Next 2 Maps show the population numbers for each county in North Dakota. The first map shows the population size of each county. The second map shows the growth or decline in population for each county from 1990 - 2000. © 2004 by David T. Olson Sample - Not for Public Use
2,283 2,242 4,831 8,585 7,149 13,674 Divide 2,610 Burke Bottineau Rolette Cavalier Pembina 2,876 Renville Towner 12,389 58,795 19,761 Walsh Ward 5,987 12,066 Williams 4,675 McHenry Ramsey 6,631 Pierce Mountrail 6,964 Benson 3,715 66,109 Nelson Grand Forks 5,737 2,757 McKenzie Eddy 5,102 1,710 Sheridan Wells 9,311 3,759 2,754 2,258 8,477 McLean 3,600 Foster Griggs Steele Traill Dunn 8,644 Mercer 2,065 Oliver 888 69,416 21,908 2,753 1,924 11,775 123,138 Billings Burleigh Kidder Stutsman Golden Valley Barnes Cass 22,636 Stark 0 to 5,000 25,303 North Dakota Counties - Population - 2000 5,000 to 20,000 Morton 20,000 to 125,000 2,308 4,701 767 5,890 2,715 Logan Lamoure Slope Ransom 2,841 Hettinger Grant 4,331 17,998 Emmons Richland 2,593 3,390 3,242 5,757 4,366 4,044 Bowman Adams McIntosh Dickey Sargent Sioux
Complete Presentation hasMap of 2000 Population Growth for Each County
The Next 2 Slides show the ethnicity of North Dakota in 1990 and 2000. The third slide shows the growth or decline in the percentage of the population for each ethnic group. © 2004 by David T. Olson Sample - Not for Public Use
The Next Graph shows the attendance numbers for the churches in North Dakota in 1990 and 2000. Evangelicals have grown in attendance, while the Mainline and Catholics have declined. Unfortunately, as overall worship attendance has slowly increased, the population has grown. A more reliable standard for evaluating increasing or declining influence is the percentage of the population attending church on any given weekend, shown in the second graph. © 2004 by David T. Olson Sample - Not for Public Use
Complete Presentation hasGraph of 1990 & 2000 Worship Percentage by Category
The Next Graph is a Pie graph visualizing the percentage of the population at churches in each category in 2000. The “Absent” category indicates the percentage of the population that is not worshipping at a Christian church on any given weekend. The second graph shows the percentage gain or decline for each category in North Dakota in 1990 and 2000. © 2004 by David T. Olson Sample - Not for Public Use
The 3 Next Charts show the relative strength of the 8 major denominational groups in North Dakota. The Pie Chart shows how much Catholics and Lutherans predominate in North Dakota. The second and third charts show that all groups have declined with the exception of the Pentecostals and the 3 Sisters. (The 3 Sisters are 3 similar evangelical denominations originally from Sweden, the Baptist General Conference, the Evangelical Free Church and the Evangelical Covenant Church.) © 2004 by David T. Olson Sample - Not for Public Use
Complete Presentation hasPie Chart of 2000 Attendance by Denominational Families
Complete Presentation hasBar Graph of 1990 & 2000 Attendance by Denominational Families
The Next Chart shows the 1990 & 2000 average church attendance by group for both this state and the nation. The second chart shows the 1990 & 2000 population per church for this state and the nation. Among states in 2000, Arkansas has the lowest population per church with 411 people per church, Utah is the highest at 4,586 people per church. © 2004 by David T. Olson Sample - Not for Public Use
Complete Presentation hasBar Graph of 1990 & 2000 Population per Church for State and Nation
The Next 3 Maps show the attendance percentages for the Evangelical, Catholic and Mainline churches in each county in North Dakota in 2000. © 2004 by David T. Olson Sample - Not for Public Use
Complete Presentation hasState Map of 2000 Evangelical Attendance Percentage for each County
Complete Presentation hasState Map of 2000 Mainline Attendance Percentage for each County
8.0% 6.6% 17.5% 10.3% 6.5% 39.4% Divide 11.0% Burke Bottineau Rolette Cavalier Pembina 9.3% Renville Towner 19.4% 8.9% 9.5% Walsh Ward 8.9% 11.9% Williams 20.5% McHenry Ramsey 7.0% Pierce Mountrail 35.9% Benson 2.2% 11.4% Nelson Grand Forks North Dakota Counties - Percentage of Population Attending a Catholic Church on any Given Sunday in 2000 2.7% 11.1% 0.0% to 9.0% McKenzie Eddy 14.1% 1.0% 9.0% to 13.4% Sheridan Wells 13.2% 12.4% 6.3% 0.0% 4.9% McLean 23.5% Foster 13.4% to 40.4% Griggs Steele Traill Dunn 10.3% Mercer 15.7% Oliver 0.3% 16.5% 8.3% 28.2% 20.2% 10.5% 6.6% Billings Burleigh Kidder Stutsman Golden Valley Barnes Cass 27.7% Stark 24.2% Morton 20.0% 12.0% 3.3% 9.6% 8.5% Logan Lamoure Slope Ransom 11.2% Hettinger Grant 30.5% 11.5% Emmons Richland 9.0% 9.0% 16.0% 6.8% 11.0% 13.4% Bowman Adams McIntosh Dickey Sargent Sioux
The Next Map shows the growth or decline in the percentage of the population attending a Christian church on any given weekend from 1990 to 2000 for each county. 16 counties grew in attendance percentage, while 37 counties declined. © 2004 by David T. Olson Sample - Not for Public Use
Complete Presentation hasState Map of 1990 - 2000 Christian Church Attendance Percentage Increase or Declinefor each County
The Next 3 Maps show the growth or decline of attendance percentages for the Evangelical, Catholic and Mainline churches in each county in North Dakota between 1990 and 2000. For evangelicals, 28 counties grew in attendance percentage, while 23 counties declined. For mainline churches, 13 counties grew in attendance percentage, while 40 counties declined. For Catholics, 19 counties grew in attendance percentage, while 34 counties declined. © 2004 by David T. Olson Sample - Not for Public Use
Complete Presentation hasState Map of 1990 - 2000 Evangelical Attendance Percentage Increase or Declinefor each County
Complete Presentation hasState Map of 1990 - 2000 Mainline Attendance Percentage Increase or Declinefor each County
74% -35% -15% -14% 9% -35% Divide -26% Burke Bottineau Rolette Cavalier Pembina -25% Renville Towner -6% 7% 12% Walsh Ward -45% -38% Williams -1% McHenry Ramsey -15% Pierce Mountrail 4% Benson -77% 5% Nelson Grand Forks North Dakota Counties- Growth or Decline in Percentage of Population Attending a Catholic Church on any Given Sunday by County - 1990 - 2000 -74% 11% McKenzie Decline Eddy -4% -59% Sheridan Wells 50% Growth -1% -4% -100% 10% McLean 140% Foster Griggs Steele Traill Dunn 15% Mercer 25% Oliver -94% 11% -18% -12% -5% -4% -40% Billings Burleigh Kidder Stutsman Golden Valley Barnes Cass -3% Stark -3% Morton -3% -11% 15% -8% 23% Logan Lamoure Slope Ransom -7% Hettinger Grant 4% -38% Emmons Richland 13% 31% 0% -14% -1% 22% Bowman Adams McIntosh Dickey Sargent Sioux
The Final Chart shows the net gain in the number of churches in North Dakota in the past decade. There was a net loss of 97 churches. However, an increase of 9 churches was needed to keep up with population growth from 1990 - 2000. © 2004 by David T. Olson Sample - Not for Public Use
The State of the Church in North Dakota . . . • Because of the stable population (no growth) in North Dakota, the church faces many challenges. • While church attendance has grown for Evangelicals, the percentage of the population attending church has been declining for the Catholic and Mainline church, while growing only for the Evangelical church. This resulted in a 8% loss in the state-wide percentage of the population that attended church between 1990 and 2000. • A major factor in the overall decline is the insufficient net gain in the number of churches in North Dakota. One hundred and six additional churches needed to have been started in the previous decade to compensate for the decline in percentage attendance. © 2004 by David T. Olson Sample - Not for Public Use
For More Information . . . • Please go to www.theamericanchurch.org for additional information on the American Church. • 12 Surprising Facts about the American Church is available athttp://www.theamericanchurch.org/12supm.htm • The complete North Dakota Powerpoint presentation is available athttp://www.theamericanchurch.org/state/UND20.htm © 2004 by David T. Olson Sample - Not for Public Use
Information on the Information • The spiritual health of churches is multifaceted, and is obviously much more complex than an attendance trend can portray. However, following the example of St. Luke in the Book of Acts, who used the number of people who showed up at various events as a sign documenting the health and growth of the early church, I would suggest that attendance is the single most helpful indicator of health, growth and decline. • Information has been compiled only for orthodox Christian groups – Protestant, Catholic and Orthodox. The Mormons, Jehovah Witnesses, Unitarian-Universalists and the International Churches of Christ have not been included. In addition, information about non-Christian groups has not been compiled. • African American denominations publish very little that is statistical – often not even a list of current churches. This study used data from the 1990 Glenmary study on Black Baptist estimates and AME Zion churches, the average African American worship attendance (from the Barna Research Group), and a statistical model based on the population of African Americans in each county in 1990 and 2000. These were combined to come up with as accurate an estimate as possible. • Independent church data is almost impossible to obtain. (There are actually fewer totally independent churches than is assumed. Most are part of some voluntary association, which typically keeps some records.) Data from the 1990 & 2000 Glenmary study on larger Independent churches (limited to over 300 in attendance) was used along with a statistical model to estimate the attendance at smaller independent churches. • In Catholic churches, the definition of what constitutes membership varies with diocese and church, making numbers sometimes inconsistent from state to state and county to county. In addition to actual mass counts from 1/3rd of Catholic parishes, membership information has been merged with attendance patterns from similar dioceses based on the size of the diocese and the region in which it is located. • Orthodox Churches are included in Totals, but not included as a separate group because of smallness of size nationwide. Division into Evangelical and Mainline categories is based on the division by the Glenmary Study. • This study only looks at how many people attend a Christian church on any given Sunday. The term ‘regular attender’ can be designated to mean someone who attends a Christian church on a consistent basis. Using a simple definition for ‘regular attender’ (attends at least 3 out of every 8 Sundays), between 23% and 25% of Americans would fit this category. Adding ‘regular attenders’ of non-orthodox christian churches and other religions to the totals would increase the percentage to 26% – 28%. © 2004 by David T. Olson Sample - Not for Public Use
This Presentation is based on a nationwide study of American church attendance, as reported by churches and denominations. The database currently has average worship attendances for each of the last 10 years for over 170,000 individual churches. It also uses supplementary information (actual membership numbers correlated with accurate membership to attendance ratios) to project the attendances of all other denominational and independent churches. All told, accurate information is provided for all 300,000 orthodox Christian churches.1 1 This presentation looks only at people attending orthodox Christian churches. Approximately 3 million people attend non-orthodox Christian churches, and perhaps 3 million attend a religious service of another religion. Those ‘houses of worship’ would add another 35,000 churches in the United States and increase the 2000 percentage to 20.5%. © 2004 by David T. Olson Sample - Not for Public Use
For More Information . . . • Presentations such as this are available for the largest 100 metropolitan areas, for each state and for the nation as a whole, as well as other presentations to show what is happening in the American church. Presentations are available either by direct download, CD or print. Please go to www.theamericanchurch.org for ordering information. • To Contact Dave Olson, please email him at DaveTOlson@aol.com. © 2004 by David T. Olson Sample - Not for Public Use