Download
1 / 15
430 likes | 1.3k Views
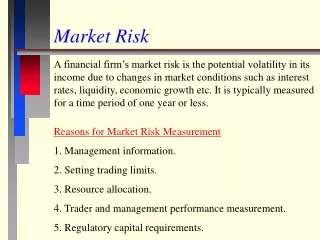
Market Risk Chapter 10. Financial Institutions Management, 3/e By Anthony Saunders. Market Risk:. Market risk is the uncertainty resulting from changes in market prices . It can be measured over periods as short as one day.

E N D
Market RiskChapter 10 Financial Institutions Management, 3/e By Anthony Saunders
Market Risk: • Market risk is the uncertainty resulting from changes in market prices . It can be measured over periods as short as one day. • Usually measured in terms of dollar exposure amount or as a relative amount against some benchmark.
Market Risk Measurement • Important in terms of: • Management information • Setting limits • Resource allocation (risk/return tradeoff) • Performance evaluation • Regulation
Calculating Market Risk Exposure • Generally concerned with estimated potential loss under adverse circumstances. • Three major approaches of measurement • JPM RiskMetrics • Historic or Back Simulation • Monte Carlo Simulation
JP Morgan RiskMetrics Model • Idea is to determine the daily earnings at risk = dollar value of position × price sensitivity × potential adverse move in yield. • Can be stated as (-MD) × adverse daily yield move where, MD = D/(1+R).
Confidence Intervals • If we assume that changes in the yield are normally distributed, we can construct confidence intervals around the projected DEAR. (Other distributions can be accommodated but normal is generally sufficient). • Assuming normality, 90% of the time the disturbance will be within 1.65 standard deviations of the mean.
Foreign Exchange & Equities • In the case of Foreign Exchange, DEAR is computed in the same fashion we employed for interest rate risk. • For equities, if the portfolio is well diversified then DEAR = dollar value of position × stock market return volatility where the market return volatility is taken as 1.65 sM.
Aggregating DEAR Estimates • Cannot simply sum up individual DEARs. • In order to aggregate the DEARs from individual exposures we require the correlation matrix. • Three-asset case: DEAR portfolio = [DEARa2 + DEARb2 + DEARc2 + 2rab × DEARa ×DEARb + 2rac × DEARa ×DEARc + 2rbc × DEARb ×DEARc]1/2
Historic or Back Simulation Approach • Advantages • Simplicity • Does not require normal distribution of returns • Does not need correlations or standard deviations of individual asset returns.
Historic or Back Simulation • Basic idea: Revalue portfolio based on actual prices (returns) on the assets that existed yesterday, the day before, etc. (usually previous 500 days). • Then calculate 5% worst-case (25th lowest value of 500 days) outcomes. • Only 5% of the outcomes were lower.
Estimation of VAR Example • Convert today’s FX positions into dollar equivalents at today’s FX rates. • Measure sensitivity of each position • Calculate its delta. • Measure risk • Actual percentage changes in FX rates for each of past 500 days. • Rank days by risk from worst to best.
Weaknesses • Disadvantage: 500 observations is not very many from statistical standpoint. • Increasing number of observations by going back further in time is not desirable. • Could weight recent observations more heavily and go further back.
Monte Carlo Simulation • To overcome problem of limited number of observations, synthesize additional observations. • Perhaps 10,000 real and synthetic observations. • Employ historic covariance matrix and random number generator to synthesize observations.
Regulatory Models • BIS (including Federal Reserve) approach: • Market risk may be calculated using standard BIS model. • Specific risk charge. • General market risk charge. • Subject to regulatory permission, large banks may be allowed to use their internal models as the basis for the purpose of determining capital requirements.
Large Banks: BIS versus RiskMetrics • In calculating DEAR, adverse change in rates defined as 99th percentile (rather than 95th under RiskMetrics) • Minimum holding period is 10 days (means that RiskMetrics’ daily DEAR multiplied by 10. • Capital charge will be higher of: • Previous day’s VAR (or DEAR 10) • Average Daily VAR over previous 60 days times a multiplication factor 3.