Download

1 / 30
300 likes | 363 Views
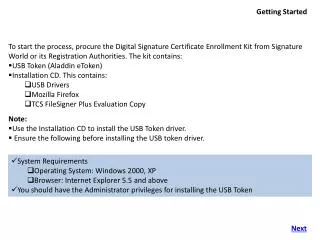
Getting started. Login procedure. URL: http://stats.icao.int User name: your initial plus surname Password: the password assigned to you. Home page. Buttons to select data module. Buttons with darkened legend are not available for selection. Basic tools.

E N D
Login procedure URL: http://stats.icao.int User name: your initial plus surname Password: the password assigned to you
Home page Buttons to select data module. Buttons with darkened legend are not available for selection.
Main tool barMain icons Clears all selections, including default values. Recommend to use the Reset button. Bookmark selections for later use or to share Retrieves saved bookmarks Lock/unlock selections
View and download data Resets data selection. Should be clicked before making a new selection. Unless changed, the data selection is kept for all relevant tabs (identified by green square in the tab) Tabs indicate different views of the basic data Active tab indicating current view Original data selection can be viewed in these tabs Downloads whole data selection into an Excel spreadsheet (double click on this object, then click on the Excel symbol)
Selecting data All selected items are shown with a green background. All other data which are available for that selection will be shown with a white background. Default values: International, scheduled, all services State(s) selected. For multiple selections (two or more States) use Ctrl-click To go directly to the entity concerned click on the magnifying glass and type name of entity you want to search in the box. After the time period and State(s) are selected, this window will show which carriers are available (white background). One can also skip State and select air carriers directly. A white X in a red circle against an entity (State, territory, air carrier) signifies that that entity no longer exists.
Special icon - Tables Clicking on this icon allows the same column to show different values, e.g. TKP- Passengers, TKP- Freight, TKP- Mail .
Special icon - Graphics Clicking on this icon allows to move quickly between different views of the data; e.g. Air carrier, Aircraft manufacturer, Aircraft manufacturer groups
Main body Buttons to select data type. Data were split into three categories so that each one would fit into a single screen. Current active view Make sure data for the same time period are available in both years for dials to show the correct percentage change
Download and print graphs Downloads data used in the graph to Excel. Enable pop-ups. Print graph
Selecting a sub-set To select a particular sub-set of the data shown in a chart, use your mouse and, keeping your left hand button in the click mode, highlight the entities concerned. This will select the data corresponding to the entities which are contained in the highlighted section for further analysis. Highlight
Selecting a sub-set (continued) Data from the highlighted section in the previous slide
Special features Toggles back and forth between Reported traffic to Total traffic, where: Reported traffic arethe data that were actually reported to ICAO; and Total traffic represents the reported traffic plus the estimated data for the non-reporting air carriers
Special features When selection is made on a from/to basis (e.g. from London to Paris), click on this button to see the data for the opposite direction (e.g. from Paris to London). City-pair distance in km based on the coordinates of the principal airport in each city.
Special features Shows the definition of the fiscal year for the selected air carriers Shows the exchange rate used to convert the data from reported currency to US Dollars
Special features The Reported data tabshows the accumulated total monthly traffic figures. This button allows to see the reported data for the individual months. Please note that some airports only report a single annual set of figures.
Special features List of air carriers which reported traffic data for the city-pairs selected. When selection is made on a from/to basis (e.g. from London to Paris), click on this button to see the data for the opposite direction (e.g. from Paris to London). City-pair distance in km based on the coordinates of the principal airport in each city.
Special features Toggle button to change the view from a quarterly trend in a single year to a trend over multiple years
Special features Toggles back and forth between the Fleet and Personneldatafor the air carriers selected Shows the definition of the fiscal year for the selected air carriers
Additional information is available in the FAQ file For assistance please contact dataplus@icao.int