Download
1 / 9
170 likes | 497 Views
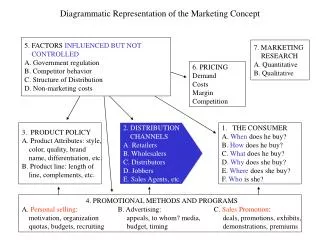
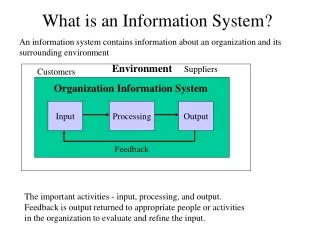
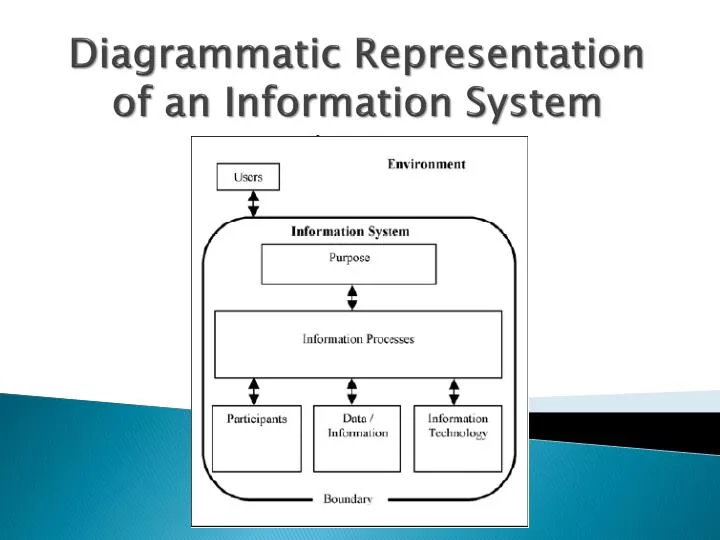
Diagrammatic Representation of an Information System. Environment. The environment is everything that influences or is influenced by an information system and its purpose. It includes any factors that affect the system or are affected by it. Example:

E N D
Environment • The environment is everything that influences or is influenced by an information system and its purpose. It includes any factors that affect the system or are affected by it. • Example: - Website: The World Wide Web, Community of People. - Real Estate Newsletter: Real Estate Agency and Local Community - KFC: Fast Food Industry and KFC Group.
Boundary • The boundary defines what is part of the information system and what is part of the environment. • Example: An online ordering system designed to process orders for a business may use the services of a payments system to process and approve credit card payments. The payments system is in the environment of the online ordering system. Refer to page 7 – ATM as an Information System
Purpose • Information systems have a purpose, which means they address the needs of a group or an individual. The system’s purpose is the reason for its existence and it used to measure success. • It should consist of a statement identifying who the information system is for and what it needs to achieve. Refer to pages 8&9 Scenario and Group Discussions.
Information Processes • What needs to be done to collect and transform data into useful information. • 7 processes: • Collecting • Organising • Analysing • Storing & Retrieving • Processing • Transmitting and Receiving • Displaying • Information processes are computer and non-computer based activities. Refer to page 10 Scenario and Group Discussion
Participants • They carry out or initiate the information processes. Users are all the people who view or make use of the information output from an information system. Participants also view or use the information from the system; however they are also actively involved in the operation of the information system. • Look at the arrows in the diagram there is a direct relation to the information processes. Refer to Group Task page 11
Users • People who view or use the information output from an information system.
Data/Information • Any of the raw material entered into the Information System. This can take form of any of the following 5 data types: • Numbers • Text • Audio • Images • Video • Output displayed such as receipts, printouts, graphs.
Information Technology • The set of tools used by an information system or its participants to perform work- it is the hardware and software used by information systems. Refer to pages 13&14 and complete Group Task and Activities.