Download

1 / 55
560 likes | 695 Views
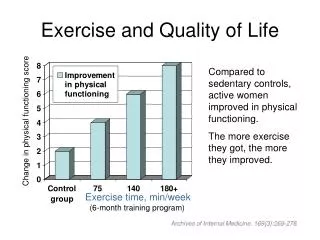
Biomedical innovation, longevity, and quality of life. Frank R. Lichtenberg Columbia University and National Bureau of Economic Research frank.lichtenberg@columbia.edu. Health is improving Longevity “Quality of life”/functional status

E N D
Biomedical innovation, longevity, and quality of life Frank R. Lichtenberg Columbia University and National Bureau of Economic Research frank.lichtenberg@columbia.edu
Health is improving • Longevity • “Quality of life”/functional status • Biomedical innovation is responsible for a significant part of improvements in health
Life expectancy at birth, by region Unlike GDP, longevity is converging
Nursing home residents 65 years and over per 1,000 population, age adjusted, 1973-1999
New drugs cost more, but are they worth more? • New drugs tend to cost more—sometimes a great deal more—than older drugs • Much of the increase in per capita drug expenditure is due to the replacement of older (often generic) drugs by newer, more expensive branded drugs • New drugs cost more, but are they worth more? • There are two main ways in which they could be worth more • They could result in better outcomes (longer life, higher quality of life, higher productivity) • They could reduce utilization of other medical care (e.g. hospitals and nursing homes)
Potential benefits of newer drugs • Longer life • Improved quality of life/functional status • Reduced utilization of other medical services • Hospitals • Nursing homes • Increased productivity/ability to work • Lower probability of being out of labor force (completely unable to work) • Fewer days of work missed by people with jobs
Role of new goods in economic growth • Solow, Technical Progress, Capital Formation, and Economic Growth: “technological progress needs to be ‘embodied’ in newly produced…goods before there can be any effect on output.” • Grossman and Helpman, Innovation and Growth in the Global Economy: “innovative goods are better than older products simply because they provide more ‘product services’ in relation to their cost of production.” • Bresnahan and Gordon, The Economics of New Goods: “New goods are at the heart of economic progress” • Bils: Measuring the Growth from Better and Better Goods, “Much of economic growth occurs through growth in quality as new models of consumer goods replace older, sometimes inferior, models.”
General research approach • Compare the health outcomes or expenditure of individuals, or groups of individuals (where group is defined by region, disease, or both) using newer vs. older drugs, controlling for other factors • Key explanatory variable is the mean vintage of drugs used by an individual or group • The vintage of a drug is the year in which the drug’s active ingredient was first marketed • Example: Anastrozole is a 1995-vintage drug
% of U.S. prescriptions that contained ingredients approved after 1985
Several types of evidence • Individual level • Aggregate level • By disease and year • By region and year • By disease, region, and year • Each approach has advantages and disadvantages
Impact of new drugs on longevity • Aggregate evidence: HIV/AIDS patients in the U.S. • Aggregate evidence: Entire populations of 52 countries • Individual-level evidence: Puerto Rico Medicaid program
No. of HIV/AIDS Rx's per person with HIV/AIDS Between 1995 and 1997, seven new molecules and two new drug classes for treating HIV were introduced
Change in average HIV/AIDS drug utilization and % change in mortality rate
Estimates of a mortality model imply that actual life expectancy in 2001 was 13.4 years higher than it would have been if the drug utilization rate had not increased from its 1993 level. About 60% of the total 22.6-year increase in life expectancy during 1993-2001 is attributable to the increase in drug utilization. • Estimates of a model of hospital discharges imply that increased utilization of HIV drugs caused hospital utilization to decline by .25 to .29 discharges per person per year. About one-third of the total decline in hospital utilization during 1993-2001 is attributable to the increase in drug utilization; 56% of the increase in HIV drug expenditure appears to have been offset by a reduction in hospital expenditure.
The impact of new drug launches on longevity:evidence from longitudinal, disease-level data from 52 countries, 1982-2001
Econometric approach • Link two major databases: • World Health Organization data on the age distribution of deaths, by country, disease, and year • IMS Health data on drug launches, by country, disease (therapeutic class), and year • Estimate relationship between cumulative number of drugs launched 3 years earlier and prob. of dying after age 65 • Include extensive controls for potentially confounding variables
IMS Health Drug Launches database • Has tracked new product introductions worldwide since 1982 • In August 2001 the database contained over 165,000 records of individual product introductions between 1982 and 2001 • Allows measurement, for each country and therapeutic area, of the total number of ingredients launched, and the number of new chemical entities launched
Example: tenecteplase Launch date Country 6/00USA 3/01Finland 5/01UK 9/01Norway 10/01Canada 10/01South Africa 11/01Ireland Tenecteplase is used to dissolve blood clots that have formed in the blood vessels of the heart and seriously lessen the flow of blood in the heart. This medicine is used to improve survival after a heart attack.
Findings • Launches of New Chemical Entities (NCEs) have a strong positive impact on the probability of survival • Launches of (older) drugs that are not NCEs—many of which may already have been on the market—do not increase longevity
Contribution of NCE launches to longevity increase • Between 1986 and 2000, average life expectancy of the entire population of sample countries increased by almost two (1.96) years. • The estimates imply that NCE launches accounted for 0.79 years (40%) of the 1986-2000 increase in longevity. • The average annual increase in life expectancy of the entire population resulting from NCE launches is .056 years, or 2.93 weeks.
Contribution of NCE launches to increase in average life expectancy of the population since 1986
Cost per life-year gained from the launch of NCEs • In 1997, average per capita pharmaceutical expenditure in OECD countries was about $250 • The average annual increase in life expectancy of the entire population resulting from NCE launches is .056 years • Hence pharmaceutical expenditure per person per year divided by the increase in life-years per person per year attributable to NCE launches is about $4500 • This is far lower than most estimates of the value of a life-year • Moreover, since the numerator includes expenditure on old drugs as well as on recently-launched NCEs, it probably grossly overstates the cost per life-year gained from the launch of NCEs
The effect of drug vintage on survival rates: individual-level evidence from Puerto Rico’s Medicaid program
Data • All medical and pharmacy claims of ASES beneficiaries during the period January 1-June 30, 2000 • Almost 800,000 people; 540,000 had pharmacy claims • About 12.2 million claims • List of all Puerto Rican residents who died during the period 2000-2002.
DIEDi = b1970 POST1970i + b1980 POST1980i + b1990 POST1990i + g Zi + ei where:
Covariates • Demographic information (age, sex, region) • Person’s utilization of services (number of physician encounters, pharmacy claims, hospital admissions during Jan.-June 2000) • Nature of person’s illnesses (diagnosis codes grouped into 15 broad disease groups)
The effect of using newer drugs on admissions of elderly Americans to hospitals and nursing homes: state-level evidence from 1993-2003
The effect of using newer drugs on admissions of elderly Americans to hospitals and nursing homes: state-level evidence from 1993-2003 • Examine the effect of pharmaceutical innovation on admissions of elderly Americans to hospitals and nursing homes during 1997-2003, using longitudinal state-level data on 12 states. • Hospital and nursing home admissions data derived from the State Inpatient Databases, which contain the universe of inpatient discharge abstracts in participating States • State-level drug utilization information for outpatient drugs purchased by State Medicaid agencies. • Very precise information about the vintage (FDA approval year) distribution of over 43,000 products utilized by 24 million people, by state and calendar quarter, from 1991 to the present. • The extent of utilization of new drugs in the Medicaid program is strongly correlated with the extent of utilization of new drugs in general.
Other factors controlled for • state and year fixed effects • per capita income • percent of state residents below the poverty line • percent of state residents with no public or private health insurance • percent of state residents who completed high school • percent of state residents who completed 4 years of college • mean body mass index (BMI) of state residents
Findings • Mean vintage of Medicaid Rx’s increased by 6.2 years between 1997 and 2003 • Mean vintage of 1997 Rx’s was 1976.0 • Mean vintage of 2003 Rx’s was 1982.6 • States that had larger increases in drug vintage had smaller increases in the number of hospital and nursing-home admissions per elderly person. • Use of newer drugs (increase in mean vintage) increased drug expenditure per person by $284-$778 in 2003 • Use of newer drugs reduced the number of hospital admissions by 6.1 per hundred people in 2003; this was worth $785 per person • Use of newer drugs reduced the number of nursing home admissions by 2.7 per hundred people in 2003; this was worth $1166 per person • Although use of newer drugs increases life expectancy, it reduces lifetime admissions to hospitals and nursing homes
ADMa Old-drug profile New-drug profile LEold LEnew
% of People Unable to Work, by Age Illness-induced early retirement of older workers: human-capital losses
Research objectives • Investigate the extent to which the introduction of new drugs has increased society’s ability to produce goods and services, by increasing the number of hours worked per member of the working-age population. • Attempt to determine whether the value of the increase in goods and services resulting from new drugs exceeds the cost of the drugs.
Previous evidence re. the impact of new drugs on ability to work Numerous case studies of specific drugs • Terbutaline (approved by the FDA in 1974) for asthma • Glipizide (1984) for diabetes • Sumatriptan and rizatriptan (1992 and 1998, respectively) for migraines. However, it is difficult to estimate from case studies the average or aggregate effect of new drugs on ability to work
National Health Interview Survey • Principal source of information on the health of the population of the United States • Survey remained the same during the period 1982-1996 • During that period, it collected information from 1,017,164 working-age Americans on 133 chronic conditions and impairments
Condition-specific data • NHIS collected information about: • whether each person was unable to work, mainly due to one of the chronic conditions, and • the number of work-days missed in the two weeks preceding the interview due to each chronic condition (for currently employed persons) • Each respondent to the survey was asked about 1/6 of the 133 conditions