Download

1 / 17
210 likes | 450 Views
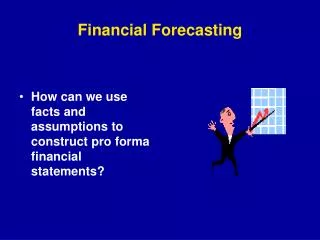
Financial Forecasting. FIL 341 Prepared by Keldon Bauer. Definitions. Financial Planning (Financial Statement Forecasting): Using the understanding of the financial system to project sales, income and assets needed based on production and marketing strategies.

E N D
Financial Forecasting FIL 341 Prepared by Keldon Bauer
Definitions • Financial Planning (Financial Statement Forecasting): • Using the understanding of the financial system to project sales, income and assets needed based on production and marketing strategies. • Assessing operating cash flows to determine financial resources needed. • Planning sources of any additional funds. • Managing cash to repay investors.
Planning - Step 1: Sales Forecast • All profit and resource (balance sheet) forecasts are based on the sales forecast. • This is probably the most difficult step. • Should be based on marketing strategy, estimates of market share, economic forecasts, etc.
Planning - Step 1: Sales Forecast • One major reason for forecasting financial statements is to plan for cash needs. Therefore it is absolutely critical that seasonal factors are taken into consideration. • Regression can be used to estimate future sales. • There are better methods available, but this is the only one with which you are likely to be familiar.
Planning - Step 1: Sales Forecast • The first step in running a time-series regression is collecting the quarterly sales. • There are two sources for quarterly sales data: • The 10-k usually contains quarterly operating information for the last two years. • If that doesn’t work, you can get the sales off the 10-Q reports (quarterly financial statements). • There is no 4th quarter 10-Q, back out fourth quarter using the annual data in the 10-k
Planning - Step 1: Sales Forecast • Collect five years of quarterly sales data, and order them from oldest to most current. • Because sales are what we want to predict, we will use them as our dependent (response) variable. • The only independent (predictor) variables we will use are time and season. • Time will indicate how many quarters have lapsed. • Season is a set of indicator (dummy) variables.
Planning - Step 1: Sales Forecast • For Rocky Shoe & Boot Company the data look like this:
Planning - Step 1: Sales Forecast • We will be using Excel’s regression function. • Make sure your copy of Excel has the Analysis Toolpak added-in. • To check, click on the Tools menu. • One option on that menu should be Data Analysis. • If that option is there then you are good to go. • If not you will have to add it in.
Planning - Step 1: Sales Forecast • If Data Analysis is not under the Tools menu, then choose Add-Ins from the Tools menu. • Then click on both Analysis Tool-Paks. • Then click OK • Now we should be ready to conduct a regression analysis.
Planning - Step 1: Sales Forecast • Under the Tools menu, choose Data Analysis. • From the dialog box, choose regression. • This will bring up another dialog box. • Using the box next to the Y-Range, highlight the Sales data you collected. • Using the box next to the X-Range, highlight the time, and seasonal variables you created. • Both of these ranges should cover just as many rows!! • Tell Excel where to put the output and click OK.
Planning - Step 1: Sales Forecast • Our model in our example has been set up to forecast sales as a function of time, and season: • Sales = constant + slope1*time + slope2*Qtr1 + slope3*Qtr2 + slope4*Qtr3 • For any quarter in the future, we will only need to forecast the time variable and the set of indicator variables to get a sales forecast.
Planning - Step 1: Sales Forecast • The forecasts based on this model can be found in this spreadsheet. • Based on the regression output, the seasons are statistically significant, but time is not. • Meaning, there is a seasonal component to their sales. • However, sales do not appear to grow over time.
Planning - Step 2: Project Income • Start from the sales forecasts • Identify those lines of the income statement that depend on sales (are variable) and those that don’t (are fixed). • Project all lines based on estimates of sales. • Using the 10-Q, regression can be used to estimate the variable/fixed components of costs as a function of sales.
Planning - Step 2: Project Income • To empirically model fixed versus variable costs, use the following regression equation: • y = fixed portion + variable portion (sales) • To estimate the fixed and variable portions, use the regression modeling functions as described earlier. • The y variable is the subject cost. • The x variable is the sales. • Excel will estimate the fixed/variable coefficients.
Planning - Step 2: Project Income • In each case, use the statistical tests to assess whether a relationship exists between the cost and sales. • If there isn’t a relationship, assume it to be a relatively fixed cost. • After using regression, use your head to come up with the final estimates, which can be vastly different from the regression estimates.
Planning - Step 2: Project Income • After you have projected all lines of the income statement, assess the dividend policy of the company. • Do they declare a fixed amount as dividends? • Do they declare a proportion of earnings as dividends? • Then project the dividends declared based on their past behavior.