Download

1 / 61
610 likes | 755 Views
Epidemiology. Epidemiology. Improve health of populations frequencies of diseases & health states (trends) factors that cause predicting occurrence & distribution factors that prevent, prolong life, improve health. Epidemiology. Identify / Explain causal factors (exposures) epidemics

E N D
Epidemiology Improve health of populations • frequencies of diseases & health states (trends) • factors that cause • predicting occurrence & distribution • factors that prevent, prolong life, improve health
Epidemiology • Identify / Explain causal factors (exposures) • epidemics • epi - above/around • dem - people
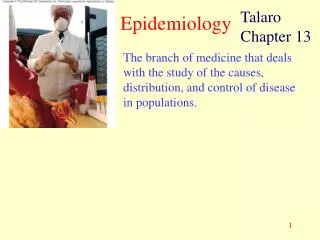
Epidemiology • Distribution and determinants • disease, injury, or dysfunction
Epidemiology Exposures risk (causal) factors • lifestyle • occupational hazards • environmental influences • interventions
Epidemiology Descriptive • distributions / patterns Analytic • cause and effect • make inferences
Epidemiology Exploratory Experimental Descriptive Cause and Effect Describe Populations Identify Relationships Clinical Trials Cohort/Case-Control Studies
Descriptive Epidemiology • Who • Where • When
Descriptive Epidemiology - Research Designs • Case report/series • Correlational studies • Cross-sectional surveys • NO Causality
# of existing cases total population at risk Measures of Disease Frequency • Prevalence • Point Prevalence
Point Prevalence • 1,000 therapists in NYS during 1999 had LBP • 10,000 therapists in NYS • P = 1000/10,000 = 10%
# of new cases total population at risk Measures of Disease Frequency • Incidence • Cumulative Incidence
Cumulative Incidence • 500 therapists in NYS developed LBP in 1999 • 10,000 total therapists • CI = 500/10,000 = 5%
# of new cases total person-time Measures of Disease Frequency Incidence Rate
Incident Rate • Of the 10,000 therapists in 1999 - 2,000 worked for only six months • 8,000 therapists contributed 8,000 person-years • 2,000 therapists contributed 1,000 person-years • IR = 500/9,000 = 5.6%
Descriptive EpidemiologyVital Statistics Birth rate Mortality rate: • total mortality - all causes • crude mortality - total mortality / avg. midyear population
Descriptive EpidemiologyVital Statistics Mortality rate • “cause-specific” - specific disease / avg. midyear population (AIDS, CAD, etc.) • “case-fatality” - deaths / individuals with disease Age-specific rates
Descriptive Exploratory Experimental Cause and Effect Identify Relationships Clinical Trials Cohort/Case-Control Studies Analytic Epidemiology Observational Studies • Case-Control • Cohort Clinical Trials • Intervention Study
Observational Analytic Designs Objective: • Test hypotheses about association/relationship of risk factors and disease
Case-Control Studies Case Definition Case Selection • population-based – general population of those w/ disorder • hospital-based – patients in medical institution
Case-Control Studies Analysis Issues • Selection bias • Misclassified • Observation/Interviewer bias • Extraneous variables
Cohort (follow-up) Studies Cohort – group of individuals followed over time Temporal component Limited use w/ rare disorders
Cohort Studies Prospective • Control and monitor data collection • Subjects readily available Retrospective • Inexpensive and faster • Incomplete/inadequate data
Cohort Studies • representative sample generalize • group identification • internal comparison • external comparison
Cohort Studies Analysis Issues • Misclassification - • Attrition -
Clinical Trials (RCT) Intervention Study Causality Rigorous - Gold standard Prospective - intervention vs. control
Clinical Trials Therapeutic • Effect of rx or intervention Preventative • Agent/procedure reduce risk of developing a disease
Clinical Trials Subject Selection • Target/Reference • Experimental/accessible population
Clinical Trials Validity • sample size • achievable • attrition
Clinical Trials Analysis • randomization • blinding • bias • ethics
Clinical Trials Analysis • tests of statistical significance (difference) • t-tests, ANOVA, etc. • causality • inferences about the population
Measures of Association - Observational Studies Test Hypotheses • Relationships • Association Exposure represents a risk factor
Measures of Association Relative Effect • Exposed:Unexposed Absolute Effect • Disease Rateexposed - Disease Rateunexposed
Relative Risk Disease No Yes a + b Yes Exposure No c + d N b + d a + c
CIE a / (a + b) = c / (c + d) CIO Relative Risk • Cumulative Incidence Estimate Exposed (CIE) • Unexposed (CIO) RR =
Relative Risk Disease Yes No Yes a + b c + d No Exposure a + c b + d N
CIE a / (a + b) = c / (c + d) CIO Relative Risk • CIE = 50/83 = 0.602 • CIO = 19/278 = 0.068 RR = 0.602/0.068 = 8.9 RR =
a / c ad = b / d bc Relative Risk • Odds Ratio – Case-control OR = = (50)(259) / (33)(19) = 20.6
a c - a + b c+ d Attributable Risk Risk Difference = AR = IE - EO AR = CIE - CIO = AR = 0.602 - 0.068 = 0.534 AR = 534/1,000
IE -IO AR x 100 x 100 = IE IE Attributable Proportion AR% = AR% =0.534/(50/83) = 88.7%
OR-1 x 100 OR Attributable Proportion For case-control (Odds Ratio) AR% = AR% = 19.6/20.6 = 95.1%
Confounding Extraneous (interfering) variable • associated w/ exposure • considered a risk factor - independently of the exposure • NOT part of the causal link
Causality Inherent to interventional research but not observation research subject to interpretation: • Time sequence • Strength of association • Biologic credibility • Consistency • Dose-Response
Other Research Approaches Historical Evaluation Methodological Secondary Analysis
Historical Research To determine: • how present conditions evolved • anticipate future events
Historical Research Incorporates: • judgements • analyses • inferences Establish relationships thru: • organizing • synthesizing
Historical Research Critical Review of: • events • documents • literature • other
Sources of Historical Data Primary • original documents • letters, videotapes, photographs, minutes • eyewitness accounts
Sources of Historical Data Secondary • biographies • textbooks • encyclopedias • literature reviews • newspaper • summaries
Historical Research Reliability and Validity • External Criticism • authenticity • Internal Criticism • content within context of question