Download
1 / 30
360 likes | 872 Views
Activity Based Costing. ENDANG DWI WAHYUNI. Latar Belakang Traditional costing volume based costing ( jml unit, jam, dst) - efektif jika : material & direct cost dominan, teknologi relatif stabil, ragam produk terbatas

E N D
Activity Based Costing ENDANG DWI WAHYUNI
Latar Belakang Traditional costing volume based costing ( jml unit, jam, dst) - efektif jika : material & direct cost dominan, teknologi relatif stabil, ragam produk terbatas Perkembangan menunjukkan banyak resources harus dikeluar- kan untuk kegiatan yang tidak berkaitan dengan jumlah pro- duksi ( set up cost, materialhandling cost, dst. )
Kelemahan Traditional Costing • Akuntansibiayatradisionaldirancanghanyamenyajikaninformasibiayapadatahapproduksi • Alokasibiaya overhead pabrikhanyadidasarkanpada jam tenagakerjalangsungatauhanyadengan volume produksi • Adadiversitasproduk, dimanamasing-masingprodukmengkonsumsibiaya overhead yang berbeda-beda
ABC • Gagasan menghitung biaya overhead berdasar aktivitas-aktivitas yang dilakukan • Pengertian : Sistemkalkulasibiaya yang menggunakansatuataulebihfaktor yang berkaitandengan non-volume dalammengalokasikankelompokbiaya overhead • Dasar Cost Driver (penggerakbiaya)
Dasar pemikiran 1 Produk Aktivitas2 Resources Cost 2 Resources Aktivitas Cost Object Resources Aktivitas • Cost Object • Produk • jasa 3 dibebankan Overhead Cost • Dgn cara : • Identifikasi • Resources yang diperlu - • Aktivitas untuk meng- • Jumlah hasilkan • Cost output • 2. Cost Driver resource cost / unit aktivitas • 3. Tiap biaya resources dibebankan ke produk/ • jasa dgn cara : • biaya per aktivitas x Jumlah aktivitas
Driver Tracing Driver Tracing Driver Tracing Assign Costs Activities Assign Costs Products ABC: Two-Stage Assignment Cost of Resources
STEP 1 • Sumberbiaya : akundalambukubesar • Analisisaktivitas : identifikasidandeskripsipekerjaan (proses, waktu, sumberdaya, nilai) • Penggolongan 4 aktivitas : • Facility sustaining activity costberkaitandenganaktivitasmempertahankankapasitas yang dimilikiperusahaan Misalbiayadepresiasi, biayaasuransi, biayagajipegawaikunci • Product sustaining activity costberkaitandenganaktivitaspenelitiandanpengembanganprodukdanbiayauntukmempertahankanprodukuntuktetapdapatdipasarkanMisalbiayapengujianproduk, biayadesainproduk • Bacth activity costberkaitandenganjumlahbacthproduk yang diproduksi Misalbiaya setup mesin • Unit level activity costberkaitandenganbesarkecilnyajumlah unit produk yang dihasilkan Misalbiayabahanbaku, biayatenagakerja
STEP 2 • Sumberdaribiaya : aktivitas • Kriteria : hubungansebab-akibat • Contoh : meter, jumlahpekerja, jumlah set up, jumlahpergerakan, jam-mesin
STEP 3 • Penentuan Output
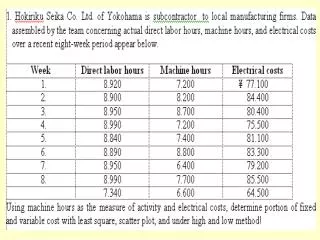
PT ABC mempunyai dua depatermen, yaitu dep I dan II yang digunakan untuk memproduksi produk A dan produk B. Data untuk menentukan biaya produk A dan B adalah sebagai berikut:
Diminta: Hitunglahhargapokokproduksiproduk A dan B denganpendekatantradisional (tariftunggaldantarifdepatermen) dan ABC sistem
Activity-Based Management (ABM) • Activity-based management (ABM) is a systemwide, integrated approach that focuses management’s attention on activities with the objective of improving customer value and the profit achieved by providing this value. Activity-based management encompasses both product costing and process value analysis. The activity-based management model has two dimension: a cost dimension and a process dimension.
Process Dimension Driver Analysis Activities Performance Analysis Why? What? How well? Products and Customers Cost Dimension Activity-Based Management Model Resources
Process Value Analysis • Process value analysis is fundamental to activity-based responsibility accounting, focuses on accountability for activities rather than costs, and emphasizes the maximization of systemwide performance instead of individual performance. Process value analysis is concerned with: • Driver analysis • Activity analysis • Activity performance measurement
Activity Analysis Activity analysis is the process of identifying, describing, and evaluating the activities an organization performs. Activity analysis should produce four outcomes: • What activities are done. • How many people perform the activities. • The time and resources are required to perform the activities. • An assessment of the value of the activities to the organization.
Those activities necessary to remain in business are called value-added activities. Value-Added Activities
Activities needed to comply with the reporting requirements, such as the SEC, are value-added by a mandate. Value-Added Activities
The activity produces a change of state. The change of state was not achievable by preceding activities. The activity enables other activities to be performed. • A discretionary activity is classified as value-added provided it simultaneously satisfies three conditions: Value-Added Activities
All activities other than those essential to remain in business are referred to as nonvalue-added activities. Nonvalue-Added Activities
Scheduling • Moving • Waiting • Inspecting • Storing Nonvalue-Added Activities
Activity elimination Activity selection Activity reduction Activity sharing Activity Analysis Activity Analysis Can Reduce Costs in Four Ways:
Efficiency Quality Time Measures of Activity Performance
Measures of Activity Performance • Value and nonvalue-added activity cost reports • Trends in activity cost reports • Kaizen standard setting • Benchmarking • Life-cycle costing • Financial measures of activity efficiency include:
Activity Activity Driver SQ AQ SP Welding Welding hours 10,000 8,000 $40 Rework Rework hours 0 10,000 9 Setups Setup hours 0 6,000 60 Inspection Number of inspections 0 4,000 15 Value-added standards call for their elimination Value- and Nonvalue-Added Cost Reporting
Value-added standards call for their elimination Value- and Nonvalue-Added Cost Reporting Activity Activity Driver SQ AQ SP Welding Welding hours 10,000 8,000 $40 Rework Rework hours 0 10,000 9 Setups Setup hours 0 6,000 60 Inspection Number of inspections 0 4,000 15
Formulas Value-added costs = SQ x SP Nonvalue-added costs = (AQ – SQ)SP Where SQ = The value-added output level of an activity SQ = The standard price per unit of activity output measure AQ = The actual quantity used of flexible resources or the practical activity capacity acquired for committed resources
Welding $400,000 $ - 80,000 $320,000 Rework 0 90,000 90,000 Setups 0 360,000 360,000 Inspection 0 60,000 60,000 Total $400,000 $430,000 $830,000 Value- and Nonvalue-Added Cost Report Value-Added Nonvalue- Actual Activity Costs Added Costs Costs
Welding -$80,000 $ 50,000 $ 30,000 Rework 90,000 70,000 20,000 Setups 360,000 200,000 160,000 Inspection 60,000 35,000 25,000 Total $430,000 $355,000 $235,000 Trend Report: Nonvalue-Added Costs Nonvalue-Added Costs Activity 2003 2004 Change